10 Best Indicators for Crypto Trading in 2026
Discover the 10 best indicators for crypto trading. Learn how to use RSI, MACD, VWAP, and more with chart examples to build a winning strategy in 2026.
GeckoScreener Team
Jul 26, 2026 · 21 min read
Updated about 2 months ago

Crypto trading is noisy, but the tools that matter are not mysterious. The best setups usually come from a small stack of indicators that tell you three things fast, trend, momentum, and whether real participation is behind the move. That's why RSI, MACD, moving averages, Bollinger Bands, and volume-based tools keep showing up in serious crypto workflows, while crowded charts tend to fail in volatile markets where contradictory signals pile up quickly. A practical rule is simple, if an indicator can't help you filter a trade, confirm a trade, or reject a bad setup, it's just decoration.
The edge comes from using indicators as a screening system, not as isolated predictions. A trader can scan Bitcoin, Ethereum, and the top altcoins for momentum, trend strength, and compression, then validate the best names with price action and backtest the idea before risking capital. That's the kind of workflow GeckoScreener is built for, and it matters because crypto moves fast enough that manual chart hopping misses clean entries. The list below focuses on the 10 best indicators for crypto trading and how to combine them in a real process that finds, validates, and tests setups.
Table of Contents
- 1. Relative Strength Index (RSI)
- 2. Moving Average Convergence Divergence (MACD)
- 3. Bollinger Bands
- 4. Average Directional Index (ADX)
- 5. Moving Averages (EMA and SMA)
- 6. Volume-Weighted Average Price (VWAP)
- 7. Stochastic Oscillator
- 8. Ichimoku Cloud
- 9. Fibonacci Retracement
- 10. On-Balance Volume (OBV)
- Top 10 Crypto Trading Indicators Comparison
- From Indicators to a Strategy That Wins
1. Relative Strength Index (RSI)
RSI gives a fast read on crypto momentum, which is why it stays in so many trader workflows. The standard setup uses a 14-period window and the familiar 70/30 thresholds. Readings above 70 point to overbought conditions, while readings below 30 point to oversold conditions. On daily charts, the 30–40 zone often matters for bounce setups, and the 60+ area can act like a pressure zone where reversals start to show up. That makes RSI more useful as a context filter than as a blind entry signal. See a working screen built around RSI in this GeckoScreener setup.
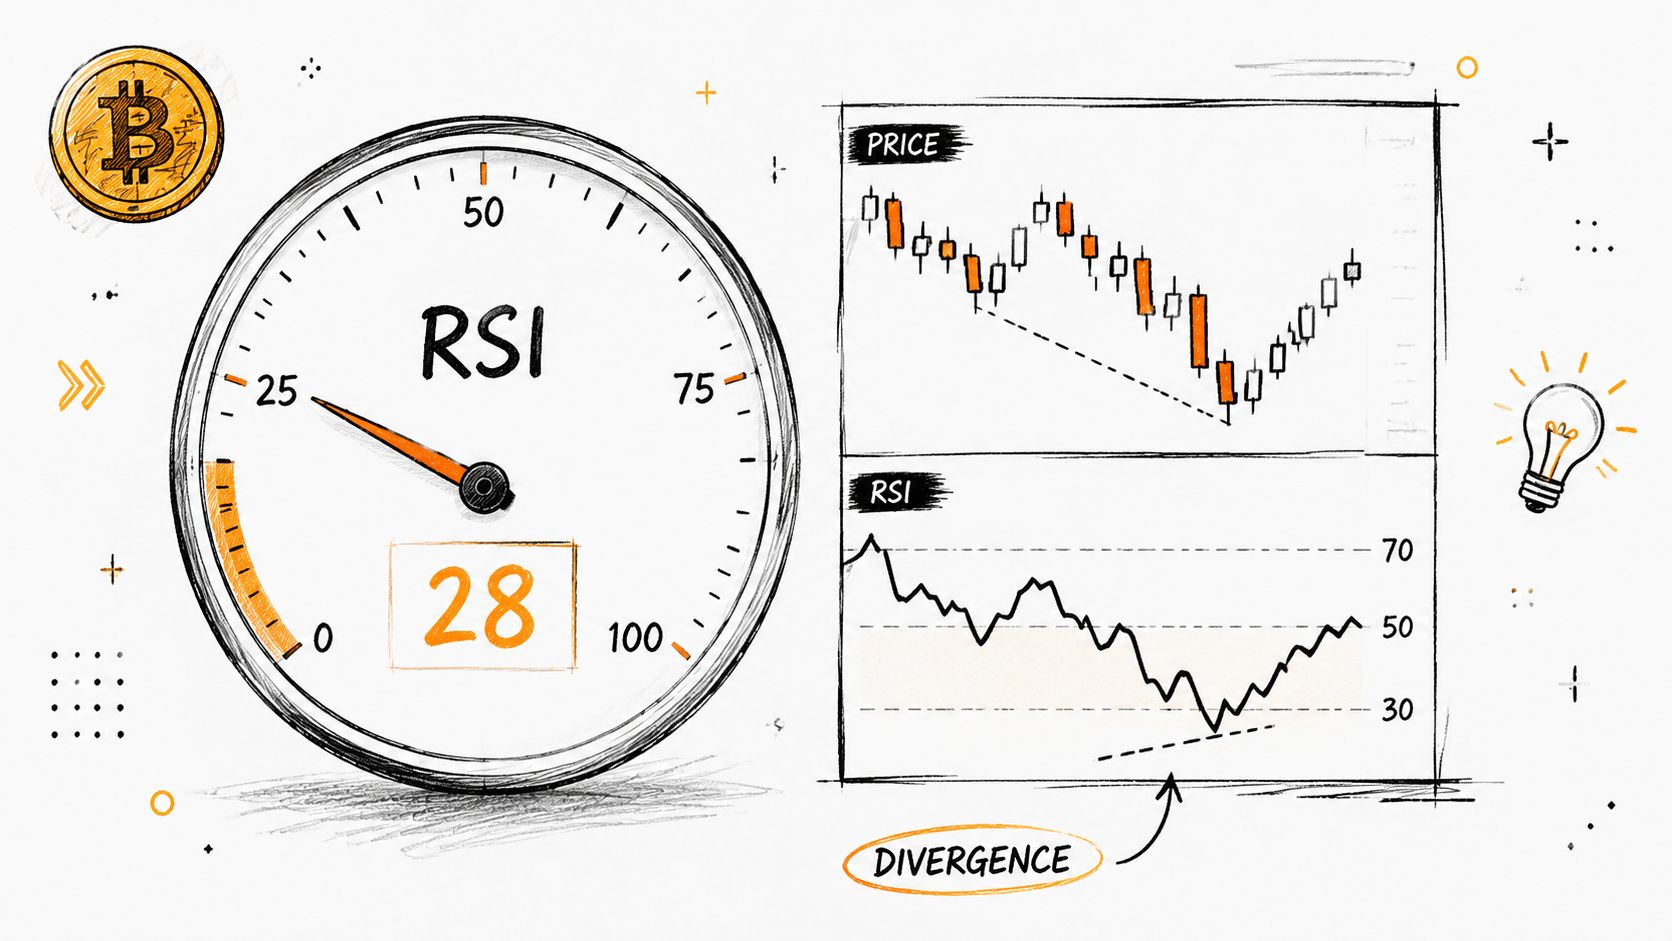
How I use RSI in crypto
RSI is most useful near a level that already matters on the chart. If Bitcoin is pushing into resistance and RSI is stretched, the move is getting extended. If Ethereum is sitting on support while RSI cools off, traders often start watching for mean-reversion entries, especially after a reversal candle or a higher low shows up. In fast crypto markets, that combination gives better trade selection than RSI alone.
- Use RSI with structure: Treat RSI < 30 as a buy candidate only when price is also at support.
- Watch divergences: If price makes a lower low but RSI makes a higher low, downside momentum is often fading.
- Respect trend strength: In strong uptrends, RSI > 70 can stay high, so it usually acts as a caution flag rather than an automatic short.
- Match the setting to the trade: Faster traders often shorten RSI for quicker reactions, while swing traders usually want more confirmation.
In a crypto screener, RSI becomes stronger because you can scan many coins at once instead of opening chart after chart. That filter is what saves time and keeps attention on the names that deserve a closer look.
Here is that filter running live. These are the coins in the top 100 sitting below 30 right now, which is the start of the work, not the trade.
Coins that are oversold right now
RSI below 30 — the zone where sellers have pushed hardest and momentum is most stretched.
IN 1d
rsi(14) < 30
14-period RSI under 30.
Loading…
Open in the screener →2. Moving Average Convergence Divergence (MACD)
MACD earns its place because it turns trend and momentum into crossover signals that are easy to test. The standard structure uses the 12-period EMA minus the 26-period EMA for the MACD line, a 9-period EMA of that line for the signal line, and a histogram that shows the gap between them. Crypto traders use it because it helps reduce the noise that comes with fast markets, especially when a move is just starting to build.
A bullish cross, where the MACD line moves above the signal line, often marks improving momentum. A bearish cross does the opposite. The histogram matters just as much, because when it expands, momentum is accelerating, and when it contracts, the move is losing force. That makes MACD a good fit for screening assets that are just leaving consolidation or starting to lose steam after a push.
Best MACD use cases
MACD is strongest when it's paired with price structure. A crossover above resistance is far more useful than a crossover in the middle of chop. That's why traders often use MACD as a confirmation layer, not a standalone entry trigger.
- Confirm breakouts: Wait for a bullish crossover after price breaks a key level.
- Read momentum loss early: If price makes a new high but MACD doesn't, trend strength may be fading.
- Use the right timeframe: Daily and 4-hour charts are usually cleaner for swing trading than very short timeframes.
- Screen for fresh momentum: In GeckoScreener, MACD filtering helps isolate coins where momentum has already turned in your favor.
The practical advantage is simple, MACD helps you avoid buying dead bounces and shorting moves that still have fuel. It's not perfect, but in a volatile market, a clean crossover plus price confirmation beats guessing every time.
The screen below looks for the cross on the candle it happens, rather than a week after the fact.
Coins where MACD just crossed bullish
The histogram has just flipped positive — a momentum shift that is still fresh, not one from last week.
IN 1d
macd.histogram > 0 AND macd.histogram[2] < 0
MACD histogram is positive now and was negative two candles ago.
Loading…
Open in the screener →3. Bollinger Bands
Bollinger Bands give traders a clean read on volatility. The middle line is a moving average, while the upper and lower bands frame how far price is stretching away from that average. In crypto, that matters because quiet markets often lead into sharp moves, and the squeeze is usually where the setup starts to matter.
Price action around the bands also needs context. A strong uptrend can ride the upper band for a long stretch, and that strength should not be dismissed as exhaustion too early. A lower-band tag in a weak market can mark either a bounce zone or a sign that sellers still control the tape. The band touch alone is not the entry, price structure and volume decide whether the move has follow-through.
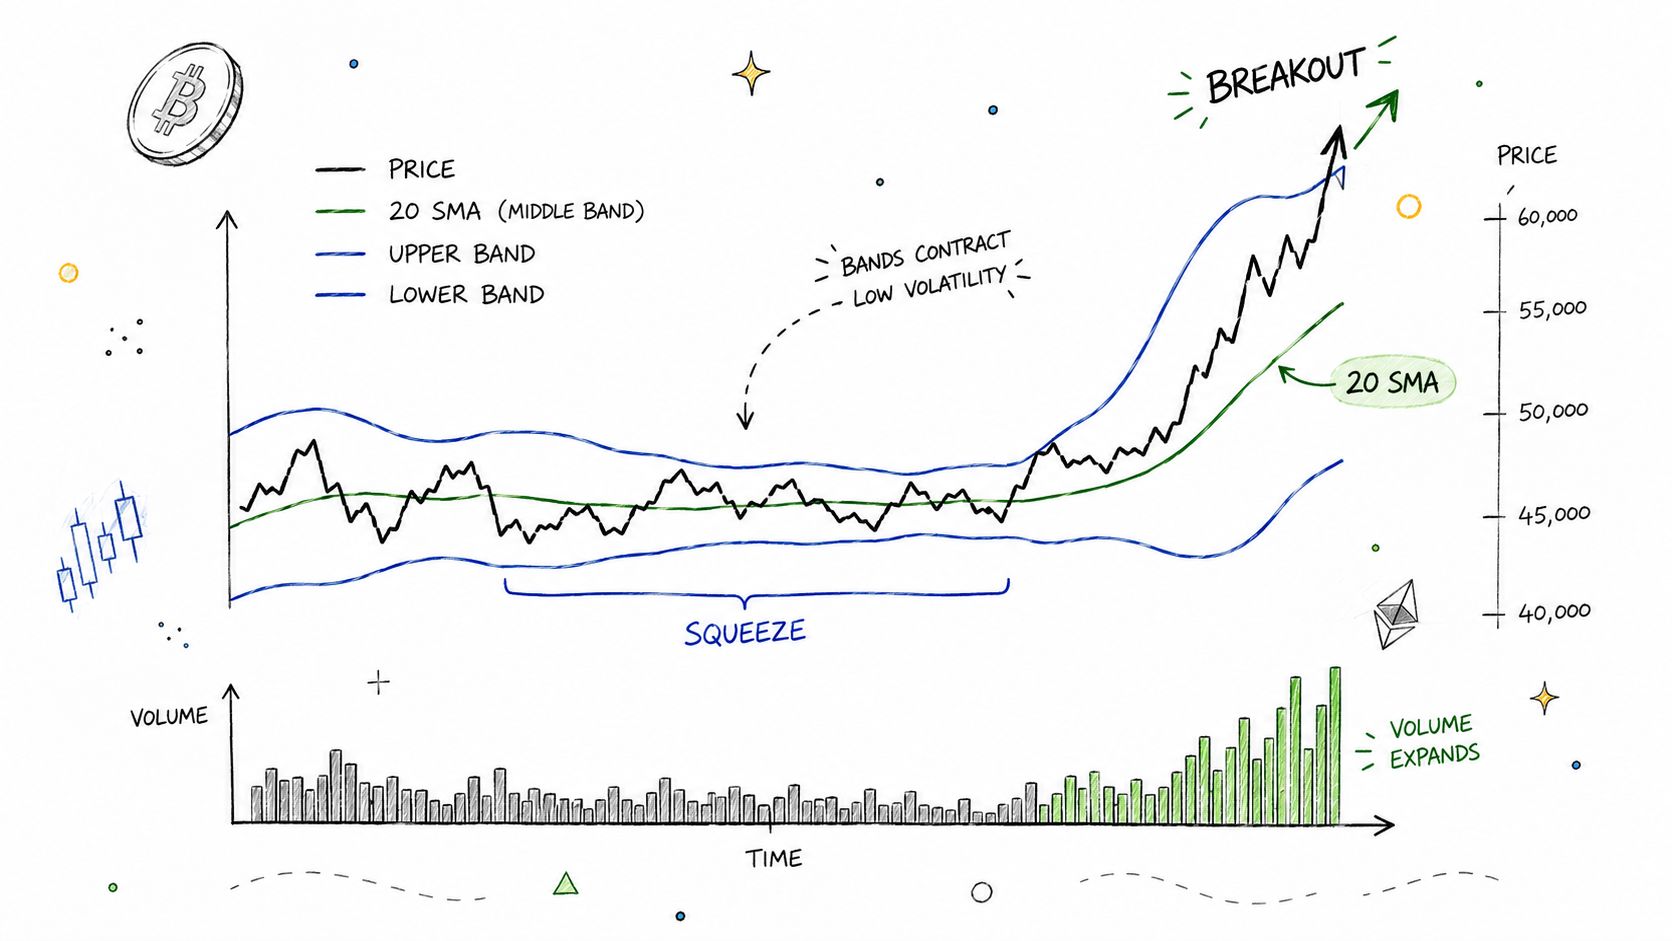
What a squeeze really means
A tight band structure says the market has gone quiet. In crypto, that quiet often breaks, and the direction of the break is what matters. Volume on the expansion is the filter that separates a real move from a fake-out.
Practical rule: A band squeeze plus rising volume is far more interesting than a squeeze alone.
Use Bollinger Bands as a volatility lens, not a stand-alone trigger. If Bitcoin is compressing tightly and then expands on strong volume, that setup is cleaner than chasing a random candle in the middle of a wide range. A screening tool helps here because you can filter for coins with unusually tight band width, then watch the names that are closest to a tradable expansion. That is also a good place to compare the setup against trend tools, such as this EMA 5 strategy for short-term crypto trades, before taking the next step.
Squeezes are easier to find than to wait through. These are the coins whose bands are compressed right now.
Coins in a Bollinger squeeze
Bands compressed to under 5% of price — the volatility contraction that often precedes an expansion.
IN 1d
bb(20, 2).width < 5
Distance between the upper and lower band is less than 5% of the middle band.
Loading…
Open in the screener →4. Average Directional Index (ADX)
ADX tells you whether a crypto market is worth trading as a trend or treating as a range. That is the edge. In a clean directional move, trend setups can work well. In choppy conditions, the same setup can turn into repeated losses. ADX measures trend strength, not direction, so it helps you decide which playbook fits the tape.
A strong ADX reading usually means the market has enough force for breakout logic or trend continuation logic to have a fair chance. A weak reading means price may still be active, but it is not committing. That difference keeps traders from leaning on moving average crosses in flat conditions, where those signals can become expensive noise.
How I use ADX in a crypto workflow
The practical value of ADX is discipline. If the market is not trending, forcing a trend trade usually leads to frustration. If the market is trending hard, fading it too early can be just as costly.
- Use trend tools only in strong markets: ADX helps you avoid breakout systems in dead chop.
- Shift to range logic when needed: Weak ADX readings often fit support and resistance trading better.
- Check for acceleration: Rising ADX with new price highs or lows usually means the move still has energy.
- Watch for exhaustion: A very strong trend can still stretch too far, so momentum needs context.
A good screener makes this faster. Instead of trying to force a breakout on a coin with no directional push, you can sort for names with stronger trend strength and focus on the ones moving with conviction. From there, ADX works best alongside price structure and volume, not as a lone signal.
Run this before any breakout setup: it separates the coins that are actually trending from the ones just moving around.
Coins actually trending
ADX above 25 — enough directional force that trend logic has a fair chance, rather than chop.
IN 1d
adx(14) > 25
14-period ADX above 25.
Loading…
Open in the screener →5. Moving Averages (EMA and SMA)
Moving averages are the plainest tool on this list and the one most traders actually keep on the chart. They smooth price into a single line, which turns a noisy candle sequence into something you can read at a glance: where the market has been trading, and which side of that level it is on now.
The practical split is simple. An EMA weights recent candles more heavily, so it reacts faster and suits active trading. An SMA treats the whole window equally, so it moves slower and works better as a slow reference level. In crypto the 50 and 200 period lines carry the most weight, mostly because so many traders watch them that they become self-reinforcing.
How I stack moving averages
A single moving average tells you very little. The information is in the relationship between two of them, and between price and both.
- Check the stack first: Price above the 50, and the 50 above the 200, is the cleanest definition of an intact uptrend.
- Use them as levels, not signals: In a real trend, pullbacks into the 50 are where entries live. A cross on its own is usually late.
- Respect the slope: A flat 200 means there is no trend to trade, whatever the cross is doing.
- Pair with ADX: Moving average crosses in a low-ADX market are the single most expensive false signal in crypto.
The screen below is the stack, not the cross: coins trading above their 50 EMA with the 50 above the 200. That is a filter you run first, then look for an entry inside the names it returns.
Coins in a confirmed uptrend
Price above the 50 EMA and the 50 above the 200 — the stack that says an uptrend is intact, not just a green candle.
IN 1d
close > ema(50) AND ema(50) > ema(200)
Close above the 50-period EMA, and the 50 EMA above the 200 EMA.
Loading…
Open in the screener →6. Volume-Weighted Average Price (VWAP)
VWAP gives traders a clearer read on where the day's trading happened. It weights price by volume, so it reflects the average price paid by active participants more accurately than a plain moving average. In crypto, where trading never really stops and volume can cluster hard around specific sessions, that difference matters.
I use VWAP as a live fair-value line. When price holds above VWAP with strength, buyers are still setting the pace. When price keeps rejecting below it, sellers are controlling intraday action. That is why VWAP shows up so often in scalping and day trading, where traders need a level that reacts to current participation instead of stale history.
Reading VWAP like a pro
VWAP works best when you treat it as a behavior line. Price that walks just above VWAP in an uptrend is usually healthier than price that spikes far away and snaps back right away. The same logic applies in reverse for short setups.
Practical rule: When price stretches too far from VWAP, mean reversion often becomes more attractive than chasing.
Use it in a real workflow. A Bitcoin consolidation around daily VWAP can set up repeatable bounce trades, while a sharp move through VWAP on heavy volume can mark a shift in control. Pairing VWAP with Bollinger Bands can help define whether price is stretched or supported, and a volume breakout setup built around VWAP is easier to test in this GeckoScreener strategy.
For fast crypto trading, VWAP is most useful as a filter before entry, not a standalone signal. If price is below VWAP and failing to reclaim it, long setups usually need extra confirmation. If price is above VWAP and holding dips, shorts need stronger evidence than a single candle reversal.
The screen below shows which coins are holding above their rolling VWAP, and by how much.
Coins holding above VWAP
Price is trading above the volume-weighted average — buyers are paying up relative to the average participant.
IN 4h
close > vwap(20)
Close is above the 20-period rolling VWAP.
Loading…
Open in the screener →7. Stochastic Oscillator
Stochastic is one of the best tools for range-bound crypto because it shows where price sits inside its recent range. It uses %K and %D lines on a 14-period basis, with values from 0 to 100. Readings above 80 usually signal overbought conditions, while readings below 20 signal oversold conditions, which makes it useful for timing reversals and short-term swings.
The indicator shines when price is moving sideways or bouncing inside a channel. In those conditions, Stochastic often gives cleaner reversal timing than a slower trend tool. It's less useful when the market is grinding strongly in one direction, because overbought or oversold conditions can persist longer than traders expect.
Using Stochastic for tactical entries
The most useful signal is the crossover. When %K crosses above %D below 30, buyers are often taking control from a weak position. When %K crosses below %D above 70, sellers may be stepping back in. Divergences at the extremes can also be meaningful if price and momentum stop lining up.
- Use it near support or resistance: Stochastic works best when structure is already in place.
- Prefer extreme readings: Signals near 20 or 80 matter more than midrange wiggles.
- Pair with candle confirmation: A hammer at oversold Stochastic is much stronger than the oscillator alone.
- Use the faster line carefully: The quicker %K line is better for timing, while %D is better for smoothing.
Dogecoin-style range behavior is where Stochastic can shine, but the principle applies across many altcoins. In a screener, it becomes more useful when combined with trend or volume filters, because then you're not just spotting an oversold chart, you're isolating one that may be ready to turn.
This one adds the turn to the oversold reading — %K below 20, but already back above %D.
Oversold coins where Stochastic is turning up
%K under 20 but already back above %D — oversold, with the first sign of a turn rather than a falling knife.
IN 1d
stoch.k < 20 AND stoch.k > stoch.d
Stochastic %K below 20 and above its own %D line.
Loading…
Open in the screener →8. Ichimoku Cloud
Ichimoku looks complex at first glance, but it solves a real problem, it shows trend, support, resistance, and momentum in one framework. The cloud is built from multiple lines, including Tenkan-sen, Kijun-sen, Senkou Span A and B, and Chikou Span, and the full structure helps traders see whether price is above, below, or trapped inside the cloud. In crypto, that matters because trend context often matters more than any single candle.
Price above the cloud usually suggests a bullish bias. Price below it usually suggests bearish pressure. Price inside the cloud often means indecision or consolidation, which is exactly where many traders get chopped up if they try to force direction too early.
Why swing traders still use Ichimoku
A clean Ichimoku read helps separate real trend continuation from a weak bounce. A cloud breakout, a bullish Tenkan/Kijun cross, and Chikou confirmation give a stronger case than reading raw candles alone. Thick clouds matter too, because they often act like heavier barriers than thin ones, and price needs more force to break through them.
Strong cloud breaks usually happen when price, momentum, and participation agree.
Use it on higher timeframes, especially 4-hour and daily charts, where its structure is easier to trust. For swing traders, that single view can replace a cluttered stack of separate lines and still keep the chart readable. It is not the easiest indicator to master, but it is one of the most complete.
9. Fibonacci Retracement
Fibonacci Retracement gives traders a practical map for pullbacks inside a trend. Plot it from a major swing high to a swing low, or the other way around, then watch the levels traders react to, especially 23.6%, 38.2%, 50%, 61.8%, and 78.6%. In crypto, those zones often help frame entries, stops, and profit targets while price pauses before the next leg.
Value comes from confluence. A Fibonacci level on its own rarely carries much weight, but when it lines up with prior support, a moving average, or a clean candlestick reversal, the setup becomes much more useful. Many traders treat Fibonacci as a planning tool, not a trigger by itself, because the level matters most after the market has already shown where buyers or sellers care.
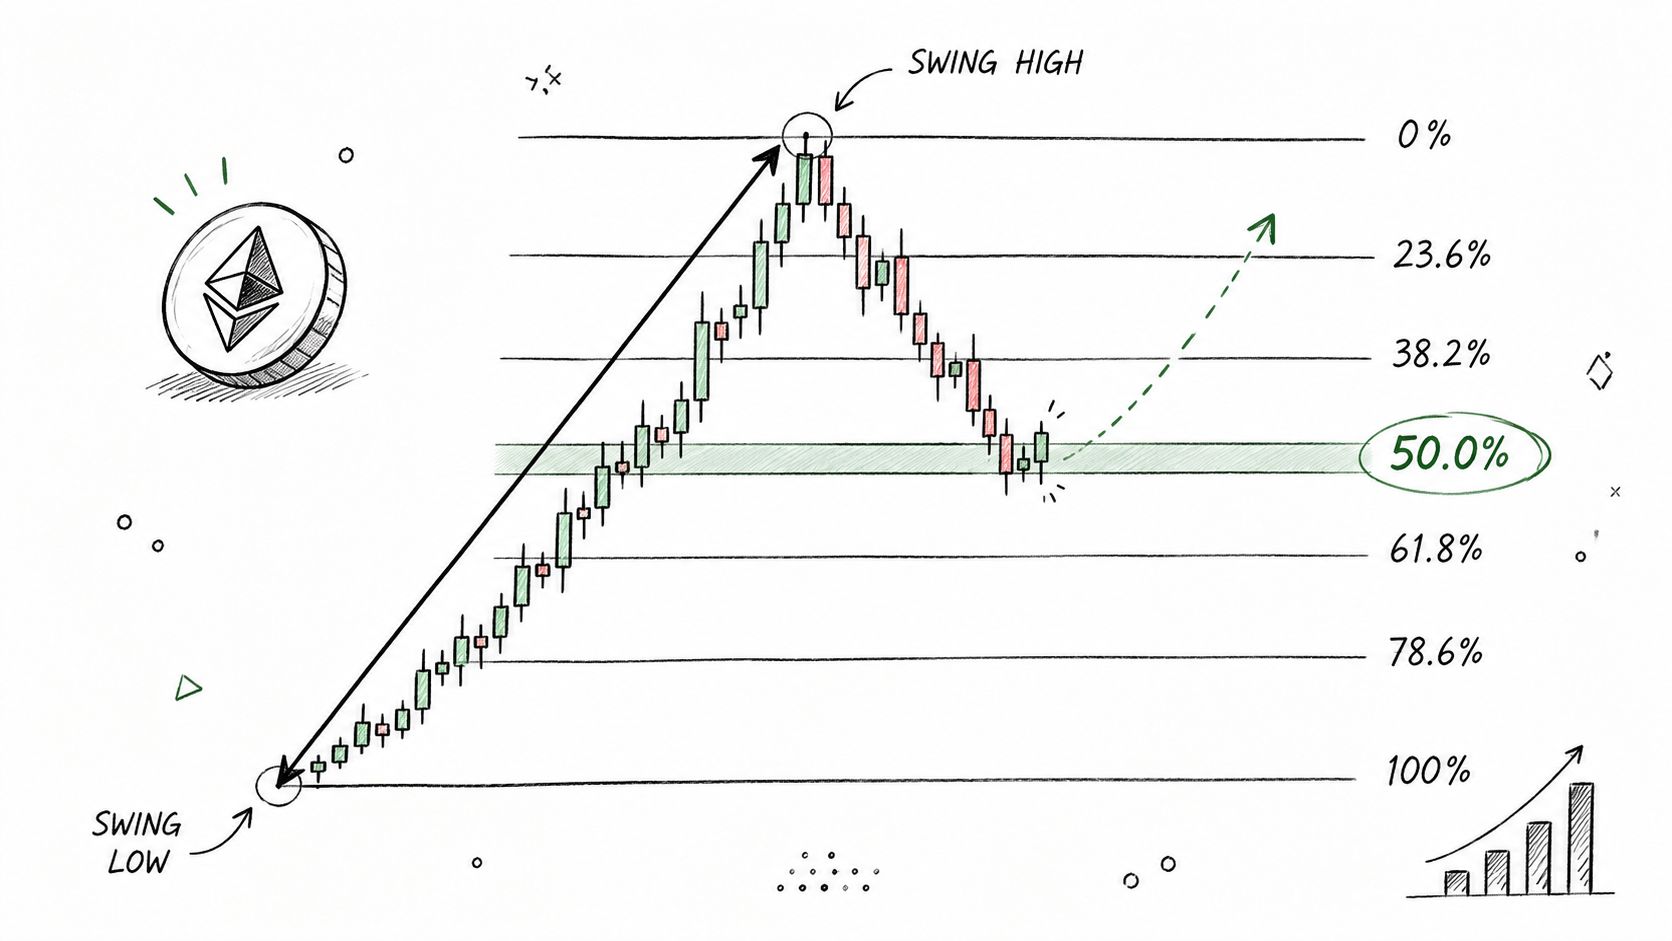
Where Fibonacci helps most
Pullbacks test discipline. Fibonacci gives you structure so you are not guessing where a trend might resume, and that matters in crypto, where sharp retracements can shake out weak hands before the move continues. If Bitcoin pulls back into the 38.2% or 61.8% zone after a strong impulse, those areas are worth monitoring for a reaction, especially if volume and price action start to agree.
A few practical rules make the tool more reliable:
- Use confluence, not isolation: Pair Fibonacci with EMA, support, or resistance.
- Wait for confirmation: A bullish candle at a key level is better than a blind limit order.
- Map the trend first: It works best after a clear impulsive move.
- Use it for scaling: Reclaimed retracement levels can work well as add points.
In a screening workflow, Fibonacci is less about checking every chart and more about refining the few candidates that already passed your trend and momentum filters. A screening tool helps surface those charts, and Fibonacci then helps separate the setups that deserve attention from the ones that only look good at a glance. That keeps the indicator practical instead of decorative.
10. On-Balance Volume (OBV)
OBV is one of the simplest ways to check whether price is being backed by real volume flow. It adds volume on up days and subtracts volume on down days, which helps show accumulation or distribution over time. In crypto, that matters because price alone can lie, but volume often exposes whether buyers are stepping in.
The best use case is divergence. If price is consolidating while OBV rises, buyers may be accumulating before a breakout. If price prints a new high but OBV fails to confirm, the trend may be running on weaker participation than the chart suggests.
Reading OBV before price confirms
OBV is especially useful for spotting quiet strength. Many of the best breakouts start with volume behavior that improves before price makes the obvious move. That's why OBV belongs near the top of any serious crypto toolkit.
- Watch rising OBV in consolidations: It can hint at accumulation.
- Respect divergence: A price high without OBV confirmation can warn that momentum is thinning.
- Use with key levels: OBV is stronger when price is near support, resistance, or breakout zones.
- Smooth it when needed: Pairing OBV with moving averages can reduce noise.
OBV is not glamorous, but it helps you avoid one of the biggest mistakes in crypto, trusting a breakout that no one is supporting with volume. In volatile markets, that filter is worth a lot.
The screen below finds coins whose OBV is higher than it was five candles ago, whatever price did in between.
Coins under quiet accumulation
On-Balance Volume is higher than it was five candles ago — volume is flowing in, whatever price is doing.
IN 1d
obv > obv[5]
OBV today is greater than OBV five candles ago.
Loading…
Open in the screener →Top 10 Crypto Trading Indicators Comparison
| Indicator | 🔄 Implementation complexity | ⚡ Resource requirements | ⭐ Expected outcomes | 📊 Ideal use cases | 💡 Key advantages / tips |
|---|---|---|---|---|---|
| Relative Strength Index (RSI) | Low, single-line oscillator, easy to implement | Low, lightweight, real-time updates feasible | ⭐⭐⭐⭐, effective at spotting reversals and divergences, prone to false signals in strong trends | Range-bound markets, divergence detection, multi-timeframe screening | Use with support/resistance or other indicators; adjust period for timeframe |
| Moving Average Convergence Divergence (MACD) | Medium, two EMAs + signal line + histogram | Low, simple EMA math, easy to automate | ⭐⭐⭐⭐, strong for trend/momentum confirmation, lagging crossovers | Trending markets, swing-trade confirmation, automated screeners | Combine crossover with price breaks; watch histogram expansion for momentum |
| Bollinger Bands | Low, SMA + std deviation bands | Low, modest computation per bar | ⭐⭐⭐, excellent for volatility signals and squeezes, no direction signal | Volatility breakouts, range trading, squeeze setups | Use band width for breakout probability; confirm breakout with volume |
| Average Directional Index (ADX) | Medium, requires +DI/-DI and ADX smoothing | Low, modest calculations, slightly more components | ⭐⭐⭐⭐, reliable trend-strength assessment, does not show direction | Regime identification (trend vs. range), sizing and strategy selection | Use ADX >25 for trend strategies; check +DI/-DI for direction |
| Exponential Moving Average (EMA) | Low, single weighted MA, multiples common | Low, minimal CPU, many periods possible | ⭐⭐⭐⭐, fast trend detection and dynamic S/R, still lags price | Trend direction, dynamic support/resistance, crossover systems | Use 50/200 for long-term bias; shorter EMAs for swing entries |
| Volume-Weighted Average Price (VWAP) | Medium, accumulative price×volume calculation, resets per period | Medium, intraday volume data required, session-aware | ⭐⭐⭐, strong intraday fair-value measure, limited for long-term use | Day trading, intraday mean-reversion, institutional-level entries | Use as dynamic S/R; watch price walking VWAP and volume confirmation |
| Stochastic Oscillator | Low, two-line %K/%D system | Low, lightweight, sensitive to noise | ⭐⭐⭐, effective in ranges for entry timing, sensitive in trends | Short-to-medium timeframes, bounce entries, divergence setups | Prefer crossovers in extremes (<20 / >80) and confirm with price action |
| Ichimoku Cloud | High, five components and forward projections | Low, moderate calculations but multiple lines plotted | ⭐⭐⭐⭐, comprehensive trend/support/resistance view, steeper learning curve | Swing/position trading, multi-factor trend systems on 4H–daily | Use cloud position for bias; validate breakouts with Tenkan/Kijun and Chikou Span |
| Fibonacci Retracement | Low, plotting horizontal ratios between swings | Low, manual swing selection, minimal compute | ⭐⭐⭐, useful objective reference levels, needs confirmation | Pullback planning, confluence zones with MAs/structure | Combine with support/resistance and candlestick confirmation |
| On-Balance Volume (OBV) | Low, cumulative volume direction metric | Low, very lightweight, trivial to compute | ⭐⭐⭐, simple volume confirmation and divergence spotting | Confirming breakouts, spotting accumulation/divergence | Smooth with MA for noise reduction; use divergences to warn of reversals |
From Indicators to a Strategy That Wins
Knowing the best indicators for crypto trading is only the starting point. The edge comes from combining them into a repeatable process that tells you what kind of market you're in, what kind of setup you're seeing, and whether the move has enough participation to matter. A crowded chart won't save you, but a disciplined stack of trend, momentum, and volume tools often will.
The most reliable framework is still the simplest one. Use a moving average or MACD to define direction, RSI or Stochastic to time momentum, and OBV or VWAP to confirm that the move has support. Add Bollinger Bands when volatility compression matters, ADX when you need to know whether the market is trending or ranging, and Fibonacci or Ichimoku when you want structure around entries and exits. That gives you a practical system instead of a pile of unrelated indicators.
A workflow built around screening is where the process becomes tradable. A platform like GeckoScreener helps you scan the top crypto assets for the exact mix you want, then turn those ideas into structured rules, then backtest them before you commit capital. That matters because the market rewards repeatable decision-making, not random chart watching.
Start small. Pick one trend indicator and one momentum indicator, then add volume confirmation only after you understand how the first two behave in real crypto conditions. Once you can describe your setup clearly, screen for it, test it, and keep the version that survives different market regimes. That's how indicator use stops being theoretical and starts becoming a trading process you can trust.
If you want a faster way to screen for RSI, MACD, EMA, ADX, and volume-based setups across major crypto coins, use GeckoScreener to build and test your strategy in one place. It's built for traders who want cleaner signals, less chart noise, and a practical workflow that helps turn indicator ideas into real, testable setups.
Crafted with Outrank app
GeckoScreener Team
Written for the GeckoScreener community. Join us on Telegram →
Related Articles
Start screening cryptocurrencies for free
Apply strategies like this one in real-time across 250+ coins.
Try GeckoScreener →