5 Types of Crypto Analysis, and How to Combine Them
The five real ways of analysing a crypto strategy: technical, fundamental, on-chain, sentiment and backtesting, plus what each one actually answers.
GeckoScreener Team
Sep 2, 2026 · 7 min read
Updated about 2 months ago

You've built a strategy, or you're about to. RSI deep in oversold territory, a hammer on the daily, maybe an MVRV reading you saw on a chart somewhere. Someone in a Telegram group tells you the Fear & Greed Index is at "extreme fear" so it's a buy. Someone else says none of that matters until you've backtested it. All of this gets called "crypto analysis," as if it's one skill. It isn't.
In short: there are five real ways to analyse a crypto strategy. Technical, fundamental, on-chain and sentiment analysis are four different lenses on the market, each answering a different question about price. Quantitative analysis, mainly backtesting, is a separate job: it checks whether your strategy's own rules actually hold up against history, survivorship bias and all. Most workable strategies borrow from two or three of the five. None of them work alone.
Technical analysis: what the price is doing right now
This is the one everyone starts with, because it's visible. Technical analysis reads the chart itself: price, volume, candlestick shapes and indicators built from those numbers, to guess where price goes next. RSI, MACD, Bollinger Bands, moving averages, a bull flag or a morning star pattern. All technical.
It answers a narrow question well: is now a good moment to enter or exit? It answers almost nothing about whether the asset is worth holding in the first place. A textbook RSI divergence works exactly the same on a coin with real usage and one with none, because the indicator only sees price. That's not a flaw. It's the boundary of the tool. A screening tool that watches 100+ coins for a pattern or an indicator condition in real time is doing technical analysis at scale. It isn't doing something else.
Fundamental analysis: whether the asset deserves the trade
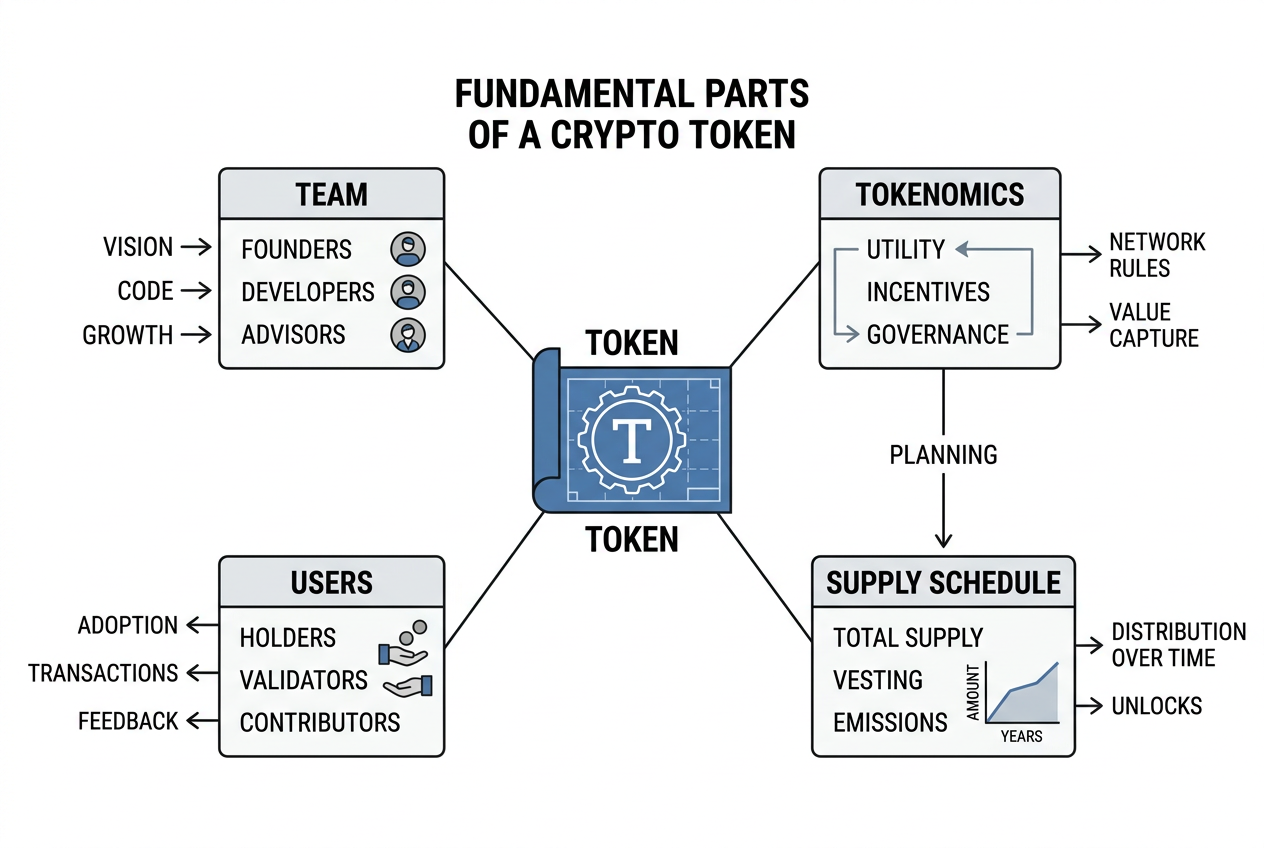
Fundamental analysis steps back from the chart and asks what the token actually is. The team behind it, the tokenomics, the supply schedule, what problem it solves, who's using it and how it sits against the macro backdrop. It's slow-moving by design. A tokenomics unlock schedule doesn't change week to week, and neither does a project's actual user count.
This is the layer that gives a strategy conviction to hold through a bad week, or a reason to stay away from a coin no indicator has flagged as risky yet. It's a poor timing tool on its own. A project can be fundamentally sound and still sink for months, so pairing it with something that reads the shorter-term picture is normal, not a compromise.
On-chain analysis: what the blockchain itself is saying
This one doesn't exist outside crypto, because it depends on a public ledger. On-chain analysis reads the blockchain directly: wallet balances, exchange flows, coin dormancy, transaction volume. No chart needed.
Two metrics show what this layer is for. MVRV compares market cap to realised cap: roughly, what the average holder paid, against what the coin is worth now. A reading above 1 means the average holder is sitting on a profit. Below 1, a loss. Every major Bitcoin cycle top has come with MVRV above 3, and every major bottom below 1, though the extremes have been shrinking as the market matures: roughly 4.2 at the 2013 top, 3.8 in 2017, 3.7 in 2021, 2.9 in 2024.
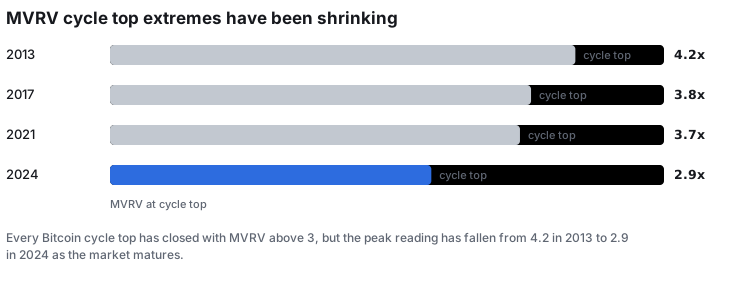
Neither metric times an entry to the day. What they do is tell you when a market's price and its actual on-chain behaviour have drifted apart, which technical analysis alone can't see because it only looks at price. If you want to see MVRV worked through on a live chart, analyst Benjamin Cowen walks through the related MVRV Z-Score on Bitcoin here.
*Bitcoin On-Chain Analysis: MVRV Z-Score, by Benjamin Cowen on YouTube.*Sentiment analysis: what everyone else is feeling
Sentiment analysis tracks the crowd, not the chain or the chart. The best-known version is the Crypto Fear & Greed Index, a single 0-100 score built from several weighted inputs. Roughly a quarter comes from Bitcoin's volatility against its 30- and 90-day average, another quarter from buying momentum and volume. The rest is a mix of social media chatter and Bitcoin's dominance of total market cap. Google search interest counts too. Extreme fear sits at 0-24, extreme greed at 75-100.
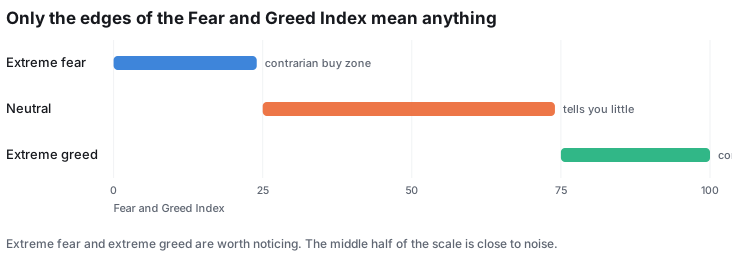
The honest use of sentiment data is contrarian and coarse: extremes are worth noticing, the middle of the range tells you almost nothing. It's also the analysis type most prone to reflecting itself, since panic and euphoria are partly what move the price the index is trying to describe. Treat it as one input, not a signal on its own.
Quantitative analysis: does the strategy actually work
Here's the split that matters most, and it's the one a lot of traders skip past. The four types above analyse the market. They tell you what to look for. Quantitative analysis, backtesting above all, analyses the strategy itself. The rules run against historical data, exactly as written, to see what would actually have happened.
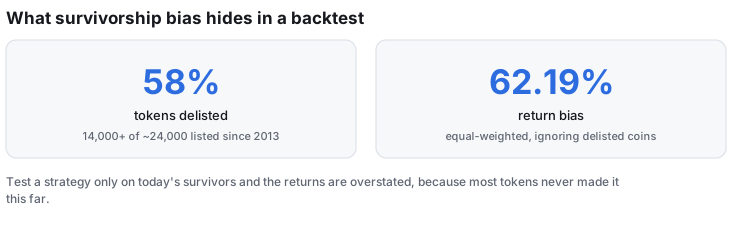
This is where good strategies get killed by good testing, which is the point. The most common way a backtest lies is survivorship bias: running the rules only against coins that are still around today. Crypto makes this worse than almost any other market. Of the roughly 24,000 tokens ever listed on CoinMarketCap since 2013, more than 14,000 (over 58%) are now dead or delisted. One academic study of 3,904 cryptocurrencies from 2014 to 2021 put the annualised return bias from ignoring delisted coins at 62.19% for an equal-weighted portfolio.
📌 Practical rule: a rising equity curve is not proof a strategy works. It's a hypothesis. It only becomes evidence once it survives delisted coins and realistic fees and slippage, tested on a stretch of data the strategy never saw while it was being built.
Using more than one at once
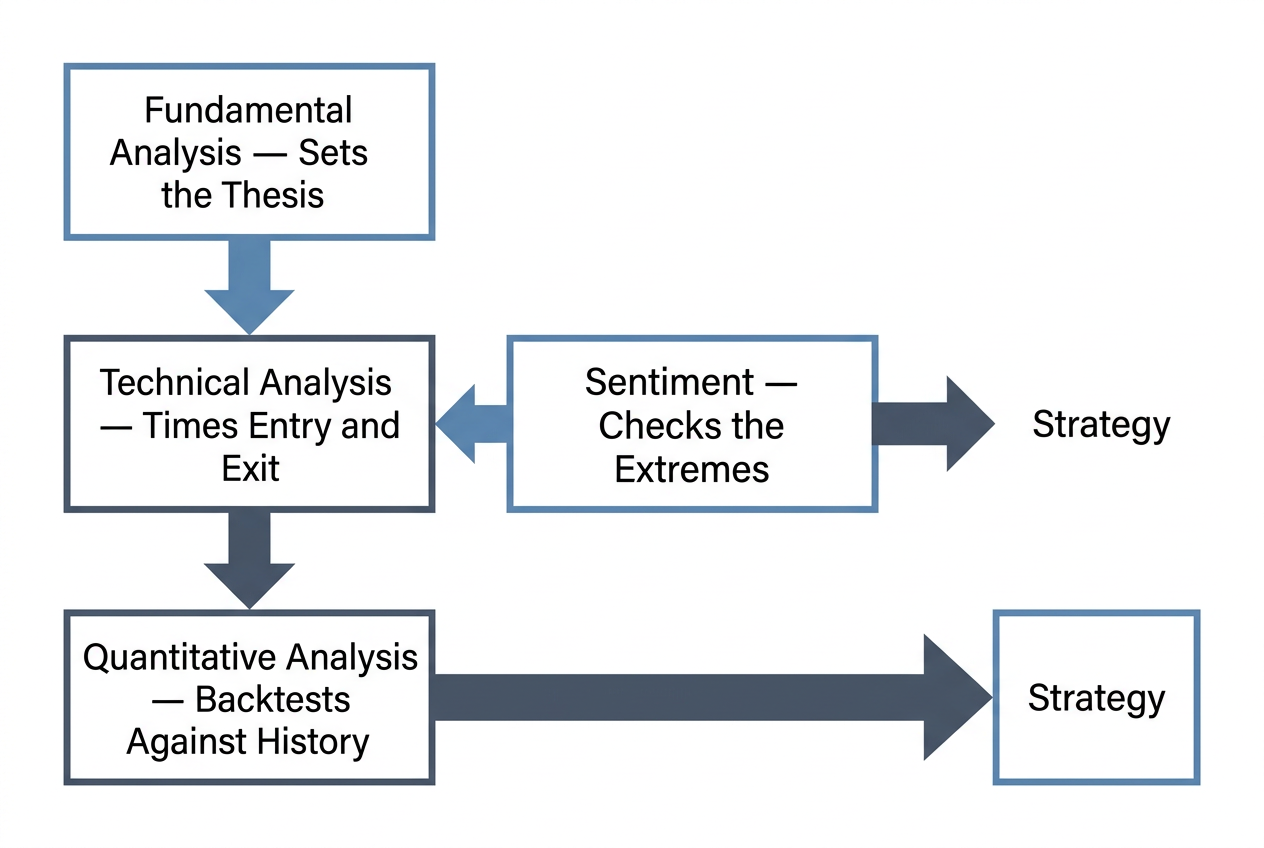
None of these five answers the whole question by itself, and that's not a limitation to work around. It's how the layers were always meant to fit. A workable process usually looks like this: fundamental or on-chain analysis sets the thesis, is this worth holding at all. Technical analysis times the entry and exit. Quantitative analysis checks the whole thing against history before real money goes in. Sentiment sits alongside all three as a check on timing at the extremes, not a reason on its own.
In practice, the market-reading layers benefit from being screened rather than watched one chart at a time. GeckoScreener covers that end now: real-time screening and pattern detection across 100+ coins, refreshed every 60 seconds, with 19 candlestick pattern detectors and a plain-language builder for turning a described setup into a live screen. Treat that as the technical and screening layer of the stack above. Portfolio-level backtesting is on the roadmap rather than confirmed live. If verifying a strategy against history is the step you're on, check what's actually shipped before you rely on it.
The question worth asking before you trade a strategy isn't "have I done my analysis." It's "which of the five did I actually do, and which one am I skipping."
GeckoScreener Team
Written for the GeckoScreener community. Join us on Telegram →
Related Articles



Start screening cryptocurrencies for free
Apply strategies like this one in real-time across 250+ coins.
Try GeckoScreener →