Dark Cloud Cover Pattern: Crypto Reversal Signals Explained
Master the dark cloud cover pattern for crypto trading. Learn identification rules, confirmation criteria, indicator confluence, and real chart examples.
GeckoScreener Team
Aug 6, 2026 Β· 13 min read
Updated 8 days ago

You're staring at a chart after a hard run higher, the kind that makes every dip buyer look late and every short look reckless. Then the next candle opens hot, prints optimism, and still closes deep inside yesterday's gains. That's where the dark cloud cover pattern earns attention, because it's one of the few reversal setups that forces you to ask a better question than βis this red or green?β It asks whether buyers really stayed in control after the open, or whether sellers took back the tape before the session ended.
Table of Contents
- When the Rally Hits a Wall
- The Two-Candle Structure and Midpoint Rule
- Historical Performance and Frequency Data
- Confirmation Criteria and Indicator Confluence
- Real Chart Examples and Decision Frameworks
- Common Mistakes and Context Traps
- Integrating Pattern Screening into Your Workflow
When the Rally Hits a Wall
A trader sees the setup on a crypto chart after a clean run higher. The first reaction is usually emotional, because the market has just rewarded patience and punished anyone who shorted too early. Then the second candle opens above the prior close, which looks like continuation at first glance, but the close sinks back into the prior candle's body and the mood changes fast.
That shift is the entire story of the dark cloud cover pattern. It's a two-candle bearish reversal that only matters after an uptrend, and the key tension is simple, buyers stretch the move, then sellers absorb that strength and push price back under the first candle's midpoint, which is the measurable line that separates a real rejection from a routine pullback. TrendSpider's guide on Dark Cloud Cover frames the pattern the same way, with the midpoint close doing the heavy lifting.
What traders are really watching
The pattern matters because it exposes exhaustion. The market opens with confidence, often on a gap up, and then fails to hold that enthusiasm through the session. That's why it reads as a reversal warning rather than a simple pause.
In crypto, this matters even more because volatility creates a lot of fake drama. A candle that dips intraday and recovers doesn't mean much by itself, but a second candle that opens strong and closes below the midpoint of the first body says sellers were willing to trade aggressively into strength. That's the difference between noise and a tradable change in control.
Practical rule: if the second candle doesn't recover the open and instead loses more than half of the prior body, treat it as a meaningful warning, not just a wick.
The pattern is most useful when it appears after a stretched move and near obvious resistance, because that's where late buyers are most exposed. Without that context, it's just two candles doing something that looks bearish.
The Two-Candle Structure and Midpoint Rule

Read the pattern candle by candle
Start with the first candle. It needs to be a strong bullish candle, because the setup only works when buyers have already shown control and pushed price higher. The second candle then opens above the prior candle's high or close, which creates the illusion of continuation before the reversal takes hold. Investopedia's explanation of the pattern describes that same sequence, the gap up, then the bearish close back into the prior body.
The midpoint is the line that separates a valid setup from a weak one. If the second candle closes below the midpoint of the first candle's real body, sellers have erased more than half of the prior session's gain. That's why the midpoint rule matters more than the color of the candle alone.
Here's the clean way to read it.
- First candle: strong bullish body, showing active demand.
- Second candle: opens above the prior high or close, showing initial buyer confidence.
- Close location: ends below the midpoint of the first body, showing that buyers lost control by the close.
Why the midpoint matters more than the gap
A gap up without follow-through is not enough. Crypto traders see gap-like behavior in many forms, especially around weekend opens on broader venues and fast momentum spikes on liquid names. The pattern only becomes actionable when the second candle gives back a serious chunk of the prior advance.
That midpoint close tells you something measurable. Buyers pushed first, sellers answered harder, and the candle finished inside the prior body instead of above it. That's a real momentum shift, not just a pause.
The internal mechanics are simple, but they're strict. If the candle closes above the midpoint, the pattern is incomplete. If it forms outside an uptrend, it's not technically valid. If the second candle barely dips into the body, the signal is weak and usually not worth forcing.
Need a refresher on reading candle structure and market context? This chart-reading guide is useful for tightening the visual scan before you commit capital.
Historical Performance and Frequency Data

What the historical numbers actually say
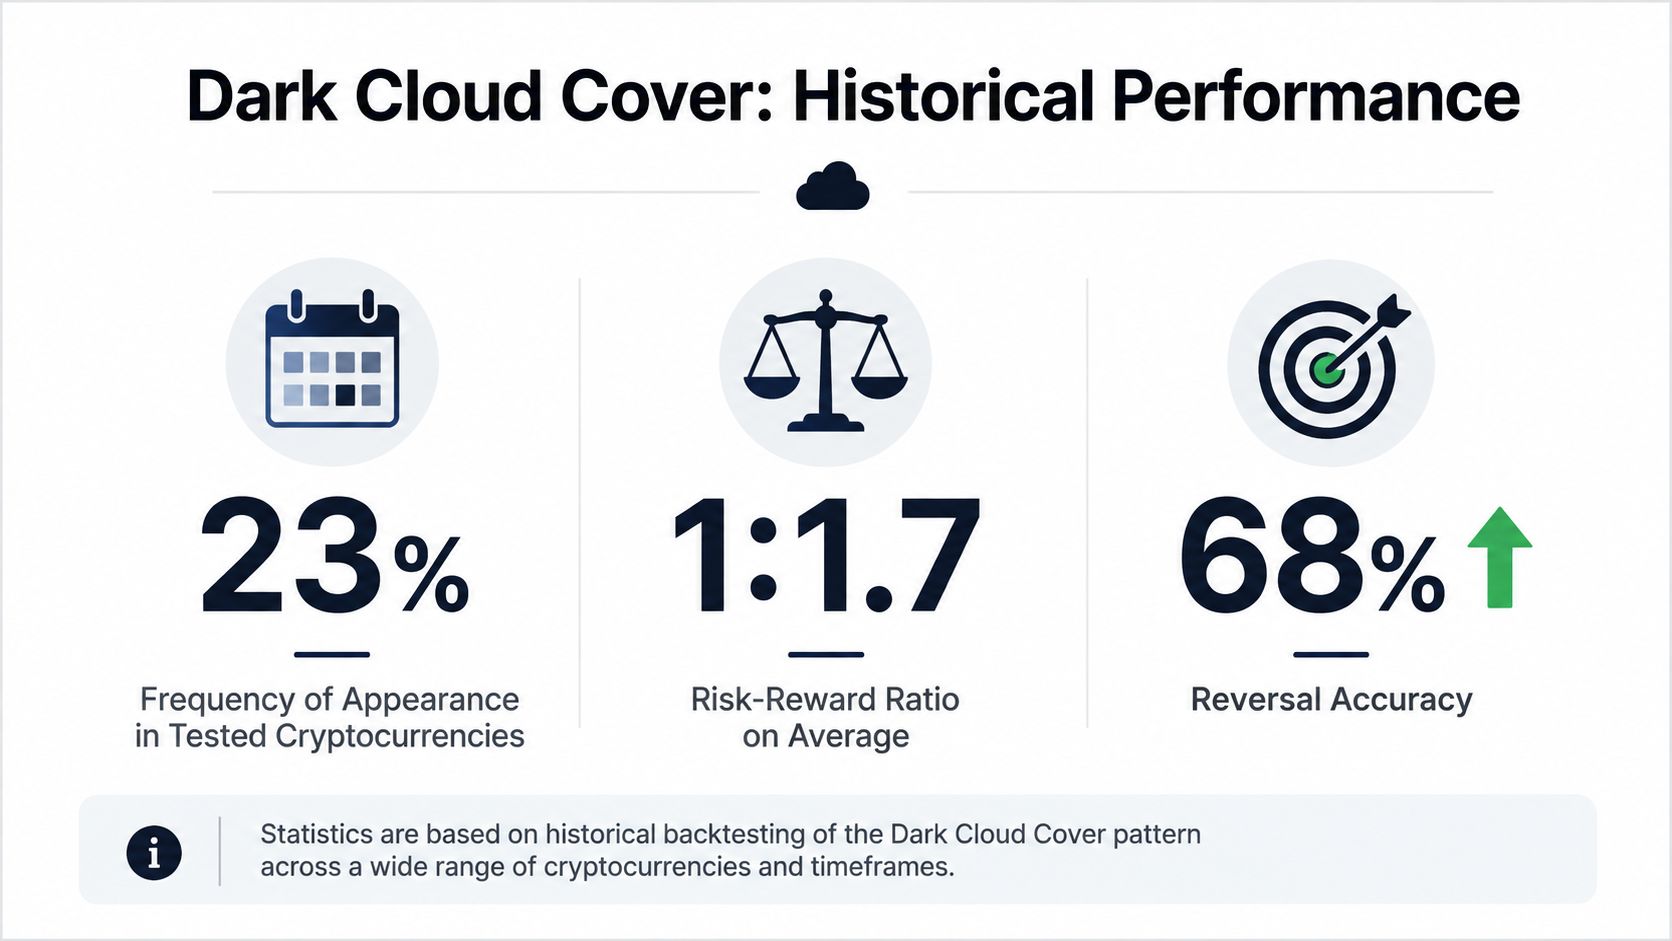
A dark cloud cover pattern earns its keep when the candle structure lines up with real follow-through, not when traders force a bearish read onto every two-candle turn. Bulkowski's testing found a 60% reversal rate from uptrend to downtrend in bull markets, and he ranked it 22nd out of 103 candlestick patterns by overall performance and 46th out of 103 by frequency Bulkowski's Dark Cloud Cover analysis. That places it in the middle of the pack on appearance, with historically respectable effectiveness when it shows up in the right spot.
Frequency is the other half of the trade-off. CandleScanner's historical scan shows 4,109 occurrences across 2,236,421 candlesticks in an S&P 500 sample of 502 symbols from 7/1/1995 to 6/30/2015, which works out to 0.64% of the candles examined CandleScanner's pattern frequency data. In a second dataset, it found 1,119 occurrences across 614,034 candlesticks, equal to 0.67%. That kind of scarcity is useful to keep in mind, because rare patterns are easy to overtrade when crypto starts whipping around.
Why intermittent patterns need patience
The reported average frequency was about 544 candles between appearances, so this is not a setup you should expect to see on every intraday scan CandleScanner's pattern frequency data. Short time windows can make it look more common than it really is, especially when volatility clusters and price keeps printing similar looking pullbacks.
The practical takeaway is restraint. A statistically real pattern can still be intermittent, and that is exactly why traders get burned when they treat every bearish two-candle formation as a short entry. The market does not owe you a clean signal on demand.
Trader's edge: the setup becomes more useful when you accept that it is selective. You do not need many signals, you need the right ones.
Bulkowski also reported a best 10-day average move of 5.36% in a bear market, up-breakout scenario Bulkowski's Dark Cloud Cover analysis. That does not mean the pattern always pays, and it does not mean the first red candle is enough to press a trade. It does show that post-signal movement can be meaningful enough to justify screening for cleaner entries, tighter invalidation, and stronger context. Before you trust any pattern too quickly, backtesting workflow basics are worth understanding so you can test whether the setup fits your market and your execution rules.
Confirmation Criteria and Indicator Confluence

What makes the signal worth acting on
A standalone dark cloud cover pattern is a warning, not a full trade. The cleanest short setups usually stack context on top of the candle structure, especially when the market is already stretched. The goal is not to add every indicator you know, it's to confirm that the reversal candle lines up with real weakness.
The strongest confluence usually starts with RSI and MACD behavior. If momentum is fading while price is still pushing higher, the reversal candle has more weight. Volume also matters, because a bearish reversal on stronger participation shows real distribution instead of a random intraday fade.
A practical confirmation stack
Use a short checklist, not an endless checklist.
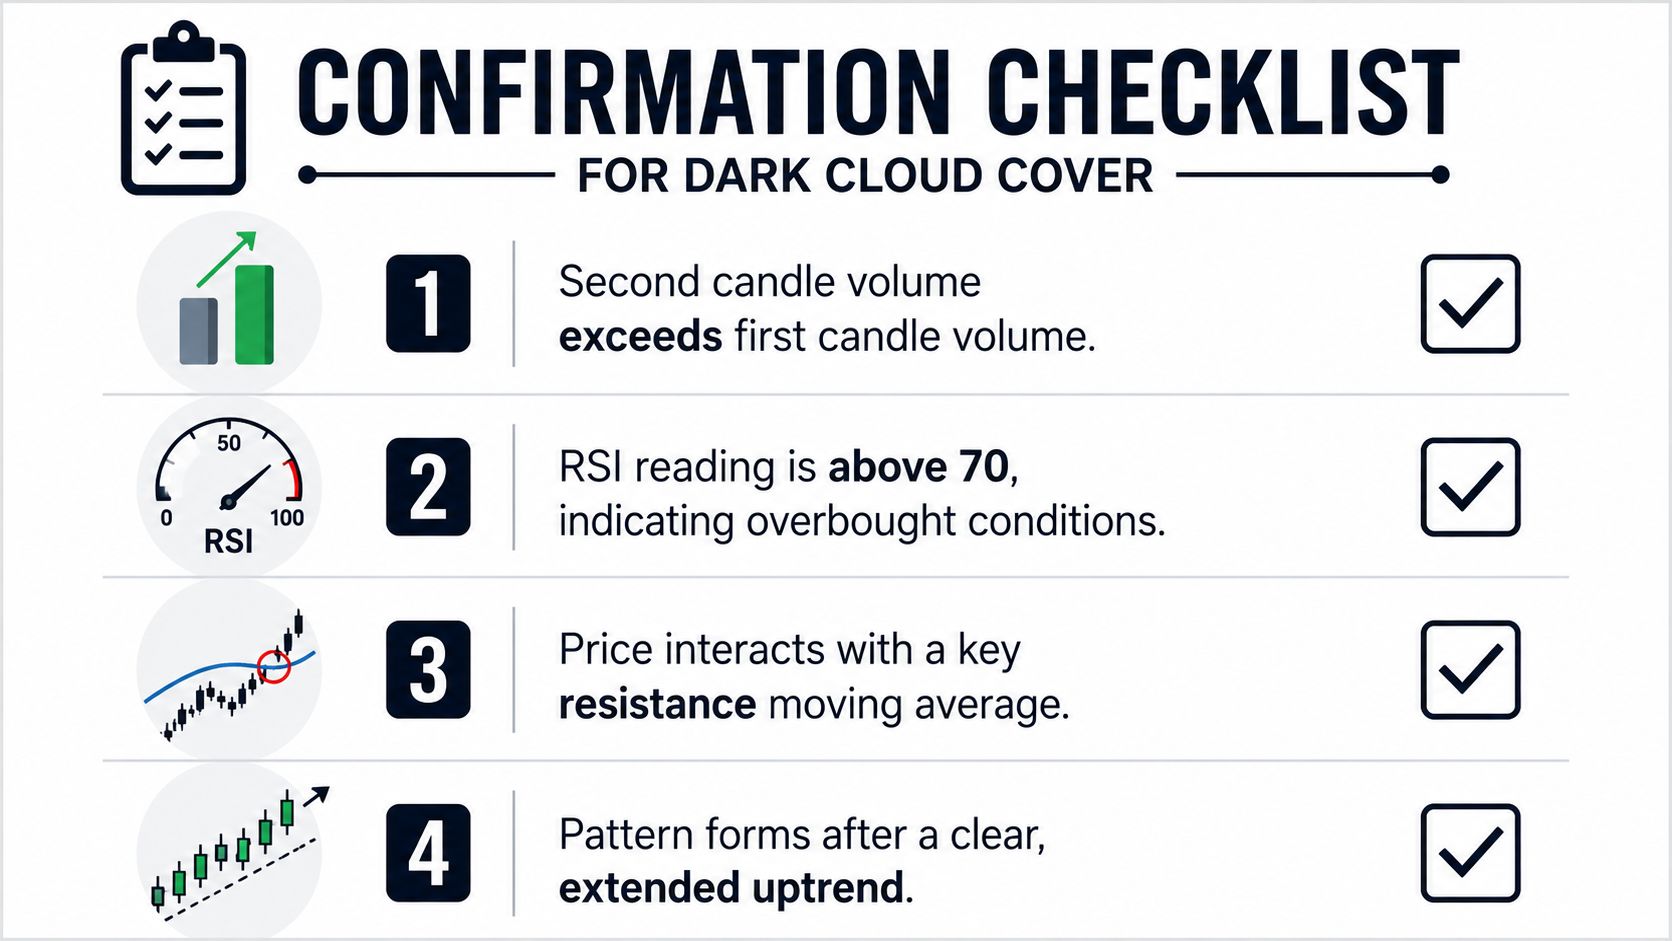
- Momentum loss: RSI is showing weakness or bearish divergence while price remains high.
- Trend exhaustion: MACD histogram is contracting, which suggests the upside push is losing force.
- Participation: the reversal candle comes with clearly heavier activity than the prior candle.
- Location: the pattern appears near a major resistance level or prior supply zone.
That last point matters more than people admit. A bearish candle in the middle of nowhere can still go nowhere. A bearish candle into resistance is a different trade because late entrants are trapped against a ceiling.
You also want to avoid overcomplicating the read. Traders often stack too many conditions and then miss good setups, or they ignore context and short every red candle. The right balance is simple, the candle pattern must be valid, momentum should be cooling, and price should be rejecting a meaningful level.
Practical rule: if the pattern appears cleanly but momentum tools disagree, stand down unless price confirms with follow-through. A clean setup with weak confirmation is still a weak setup.
Crypto markets reward discipline more than pattern worship. The dark cloud cover is strongest when the candle structure, momentum, and location all point the same direction.
Real Chart Examples and Decision Frameworks
A valid example usually starts with a stretched rally into resistance. The first candle closes strong, the second opens higher, and by the close the market has given back enough ground to finish below the midpoint of the first body. That's the version you can work with, especially when the next candle breaks lower and confirms that sellers are still active.
An invalid version looks similar at first. Price opens higher, sells off a bit, but the close stays above the midpoint of the prior candle. Traders often force that into the category because it βlooks bearish,β but it doesn't meet the rule that makes the pattern worth trading. In those cases, the market is often just pausing, not reversing.
How I separate valid from borderline
I use a simple decision filter.
- Confirm the trend first. If price hasn't been rising, I don't treat the setup as valid.
- Check the close, not the wick. A long lower wick doesn't rescue a candle that closes below the midpoint.
- Look for nearby resistance. If the pattern prints into a known ceiling, it has more weight.
- Wait for follow-through when possible. One candle can warn. The next candle can confirm.
Borderline cases happen more often on lower timeframes. Intraday candles on crypto pairs can look textbook and still fail fast because liquidity shifts, flushes, and short-term mean reversion all hit at once. Daily and weekly charts usually give a cleaner read because they absorb more noise and reflect larger participation.
A good pattern doesn't need your urgency. It needs your discipline.
The best decision framework is boring. Valid pattern, clear prior uptrend, midpoint breach, then confirmation from price structure or indicators. If any of those pieces are missing, the trade should get smaller, slower, or skipped entirely.
Common Mistakes and Context Traps
The biggest mistake is treating the dark cloud cover pattern like a standalone oracle. It isn't one. The pattern is technically valid only after an uptrend, and traders who ignore that rule end up shorting noise in sideways markets where the candle tells them almost nothing.
Another trap is misreading the midpoint. Many traders glance at a red candle closing inside the prior body and assume that's enough. It isn't. If the close doesn't land below the midpoint of the first candle's real body, the setup lacks the threshold that defines the signal.
Where traders usually go wrong
- Ignoring trend context: sideways ranges can produce candles that resemble reversals but don't carry the same meaning.
- Forcing a weak close: if the candle only slips slightly into the prior body, that's not the correct pattern.
- Trading without confirmation: a bearish-looking pair of candles is not the same as a tradeable reversal.
- Confusing similar structures: the dark cloud cover is not the same as a bearish engulfing pattern, because the bearish engulfing fully overtakes the prior body while this setup only closes significantly into it.
The difference matters because pattern strength changes with the amount of control sellers prove they have. Partial penetration says sellers are gaining ground. Full engulfment says they've taken the wheel more decisively.
Crypto punishes shortcuts. Fast markets create plenty of sharp-looking reversals that fail in minutes, especially when broad trend strength is still intact. The pattern can still work, but only when you respect the wider market picture and avoid treating every red candle as a signal.
For a clean comparison of similar reversal logic, the piercing line candlestick pattern guide is a useful mirror image to study.
Integrating Pattern Screening into Your Workflow
Manually hunting for the dark cloud cover pattern across dozens of coins is inefficient, and it usually leads to cherry-picking. Screening is better because it lets you find valid structures fast, then spend your time on the part that needs judgment, context and risk management.
A good workflow starts with pattern detection, then layers in filters that match your playbook. You want the scan to find only names where the prior trend exists, the second candle closes below the midpoint, and the chart sits near a level that matters. After that, you can decide whether the setup deserves a short, a long exit, or a pass.
What a clean workflow looks like
- Scan broadly: look across a basket of liquid crypto assets instead of staring at one chart.
- Filter structurally: keep only charts with a valid two-candle reversal after an uptrend.
- Add confluence: check momentum, volume, and resistance before acting.
- Rank by quality: prioritize the cleanest setups instead of trading every match.
- Execute with rules: define stop placement and invalidate the trade quickly if price reclaims the pattern.
That sequence helps because the market gives you a lot of almost-signals. Most are not worth acting on. A screening layer reduces the time between pattern formation and review, which is important in crypto where conditions can change quickly.

The edge is not automation for its own sake. It's using screening to isolate high-quality candidates, then applying human judgment to the parts a machine can't price cleanly, like broader market tone, overhead supply, and whether the chart is worth a trade.
If you want a faster way to spot valid dark cloud cover pattern setups across crypto, use GeckoScreener to scan liquid coins, filter for candlestick patterns plus indicator confluence, and keep your attention on the charts that matter. It's a practical way to cut noise, organize your review process, and stay ready for the next reversal that deserves a real trade.
GeckoScreener Team
Written for the GeckoScreener community. Join us on Telegram β
Start screening cryptocurrencies for free
Apply strategies like this one in real-time across 250+ coins.
Try GeckoScreener β