How to Backtest Trading Strategies Without Fooling Yourself
Learn how to backtest trading strategies step by step. Covers setup, parameter choices, walk-forward testing, and reading equity curves and trade logs.
GeckoScreener Team
Jul 29, 2026 · 16 min read
Updated about 2 months ago
Most traders ask the wrong question about backtesting. They ask whether a strategy would have made money, when the harder and more useful question is whether the rules can survive the ugly parts of trading, like spread, slippage, regime shifts, and your own temptation to optimize every knob until the chart looks perfect. A profitable in-sample backtest can be the most dangerous outcome, because it often means the strategy was tuned until it fit the past instead of surviving it.
Backtesting is useful when it acts like a stress test for a trading idea. The point is to learn whether the edge is broad and repeatable, or narrow and fragile, and whether the equity curve keeps working when assumptions get less friendly. The best work happens after the first promising run, when you start asking what breaks, what stays stable, and what only looked good because the test was too clean.
Table of Contents
- What Backtesting Really Tests
- Defining Mechanical Rules That Leave Nothing to Interpretation
- Running Your First Backtest Step by Step
- Reading the Equity Curve Like a Risk Manager
- Extracting Truth From the Trade Log
- Validating With Walk-Forward and Out-of-Sample Testing
- From Backtest to Live Without Losing Money
What Backtesting Really Tests
A good backtest does not predict the future. It tests whether a rule set can survive historical market conditions, and whether the strategy's edge is wide enough to withstand friction, regime shifts, and execution mistakes. The most useful backtests are often the ugliest ones, because they show what the strategy cannot handle before real money is on the line.
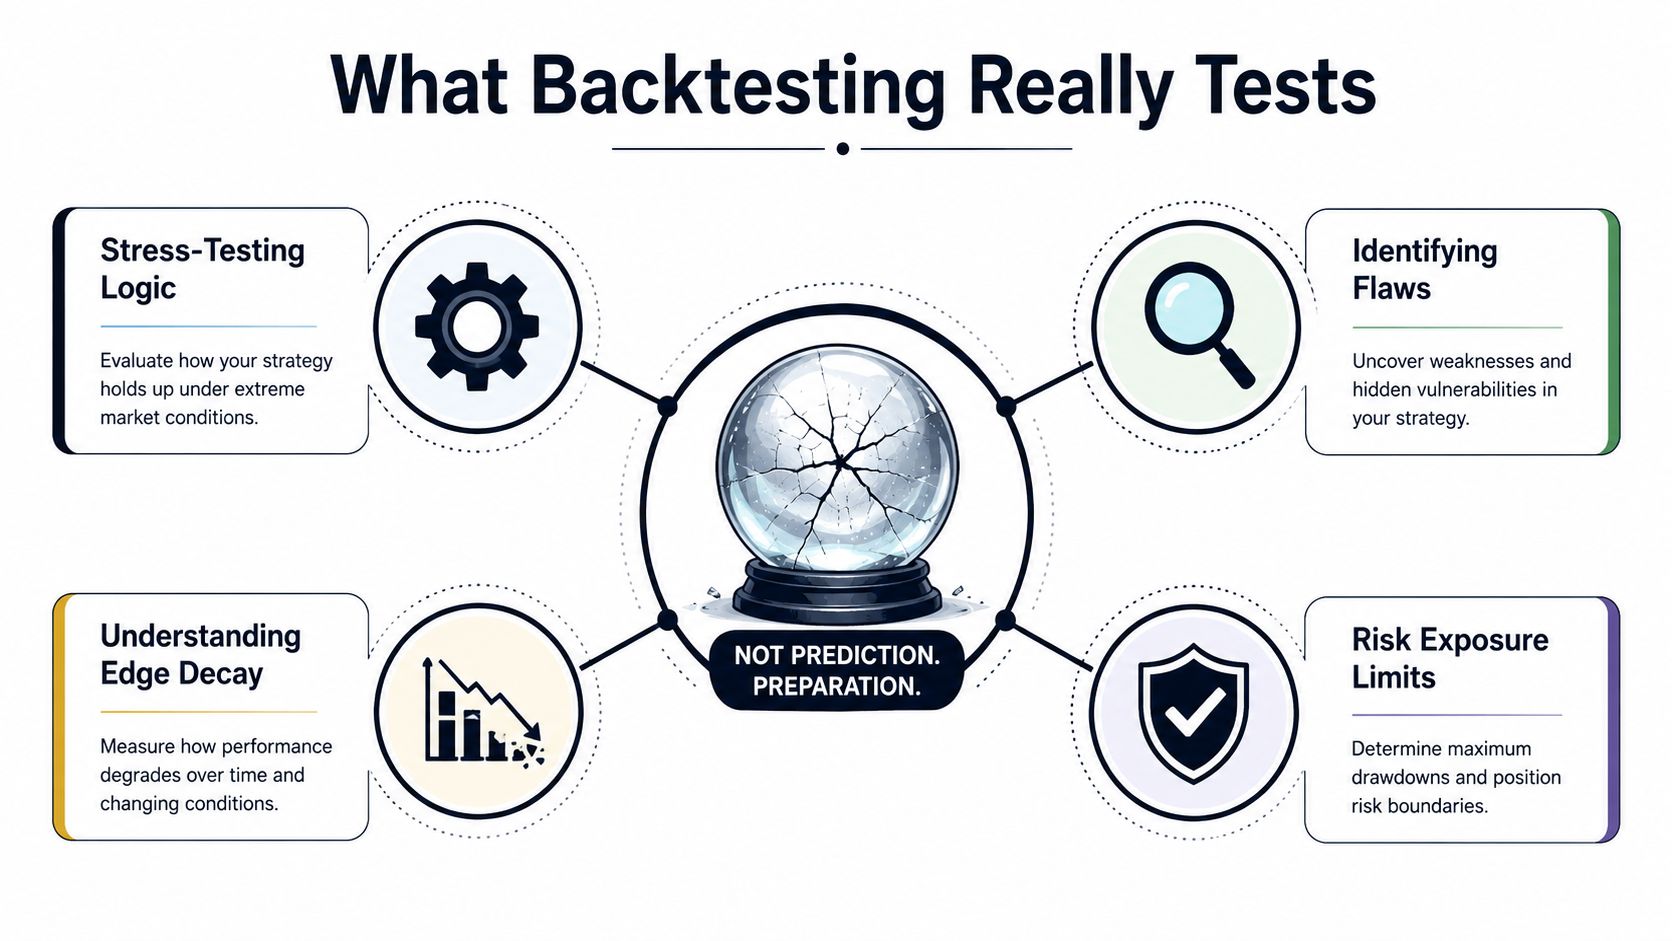
The target is a resilient process
A thorough backtest is built in stages. Start with fully mechanical entry and exit rules, test across at least 5 years of data, preferably 10+, include multiple market regimes, and then spend most of your time stress-testing assumptions instead of chasing the headline return. That approach matters because a strategy can look brilliant in a narrow sample and still collapse once execution gets imperfect. For a practical indicator framework, a useful reference is this overview of the best indicators for crypto trading.
Practical rule: if performance only works around one setting, it is not a strategy yet. It is a coincidence with a chart.
The plateau idea matters more than the peak. Parameter-sensitivity sweeps, where you vary stop-loss and profit-target values across a range, are useful because reliable systems keep working over a zone of values, while fragile systems spike at one exact setting. That is the difference between a strategy built on structure and one built on curve fit.
What goes wrong in practice
Survivorship bias and look-ahead bias can both make a backtest look smarter than it really is. Survivorship bias shows up when you only test assets that survived the period, while look-ahead bias sneaks in when the model uses information that would not have been available at the time of the trade. Traders often think they found an edge when they really found a cleaner dataset than live trading will ever give them.
A classic failure case is a breakout system that looked great until real fills were modeled. The signal was fine on paper, but once spread and slippage were added, the edge vanished because the trades were too dependent on perfect execution. A pretty equity curve should trigger skepticism, not celebration.
Defining Mechanical Rules That Leave Nothing to Interpretation
A strategy only becomes testable when every part of it can be executed without judgment. “Buy oversold RSI” is a concept, not a rule set. A machine can't test feelings, hesitation, or a vague sense that the chart “looks stretched,” and neither should you.
Turn the idea into a full specification
Define the entry condition first. If the idea is an RSI pullback in crypto, spell it out as something like RSI crossing below 30, but only when price is above the 200-EMA trend filter. That gives the system a clear directional filter instead of letting it buy every oversold dip in a downtrend.
Then define the exit logic with equal precision. Use a fixed stop-loss, a profit target, and a disqualification condition if the setup is invalidated before the order fills. A 2 percent stop is easy to test because it's explicit, repeatable, and can be compared across versions of the same strategy.
One useful way to structure the rules is this:
- Entry trigger: what exact signal opens the trade.
- Trend filter: what must already be true about the market.
- Stop-loss: where the trade fails.
- Take-profit: where the trade succeeds enough to exit.
- Position sizing: how much capital each trade uses.
- No-trade conditions: what blocks a setup even if the signal appears.
If any one of those is missing, the backtest becomes ambiguous. Ambiguity is where discretionary loopholes sneak in, and loopholes are where live performance gets destroyed.
A crypto example that can actually be tested
A clean crypto version might read like this. Buy when RSI crosses below 30, only if price is above the 200-EMA, set a fixed stop at 2 percent, and exit at a defined profit target or stop. That structure is easy to compare across coins and time periods, and it avoids the trap of changing the rules after the trade has already happened.
If you're building indicator-based crypto setups, the selection logic around RSI, EMA, and similar tools needs to stay consistent across tests. The indicator mix you choose should match the market behavior you want to capture, not the one that made the prettiest backtest on one coin, which is why a focused reference like the best indicators for crypto trading matters as a starting point rather than a final answer.
If a rule can't be written down in one sentence, it probably can't be tested cleanly.
Running Your First Backtest Step by Step
The mechanics matter because most bad backtests come from sloppy setup, not bad ideas. A repeatable workflow beats improvisation every time, especially when you want to compare versions of the same strategy later and know whether the difference is real.
Load the rules, then freeze the setup
Open the strategy tester, load the strategy, write the rules in plain language, and set the dataset date range before you touch any optimization. People skip that sequence and end up testing whatever data happens to be on screen. A proper workflow is a configuration exercise, not a guessing game, and that is how the process is described in a standard backtesting walkthrough (IG backtesting guide).
Pick a date range that covers at least one full market cycle. Don't choose a period because it flatters the strategy. If the logic only works in one kind of trend, that should show up immediately instead of being hidden behind selective dates.
When you use a platform like GeckoScreener, treat the first runs as exploratory. The first few tests should show whether the strategy behaves sensibly, whether the exit logic is too tight, and whether the filter combination is doing real work. The backtest is not there to prove anything yet, it is there to stop you from spending time on dead ideas.
Compare modes before you trust the output
Single-coin testing and portfolio-mode testing can show very different behavior. A strategy that looks acceptable on one asset may fall apart when rotated across a basket, while another may be mediocre on one chart but useful across a broader universe. If you do not compare both, you can miss the fact that your edge is really just one coin's personality.
Keep a clean record of every parameter choice. Log the symbol universe, date range, stop-loss, profit target, filters, and any changes between runs so the test can be reproduced later. The platform can give you the output, but your notes are what make the result defensible.
I have seen traders run ten versions of the same idea and then forget which one produced the good curve. That is not strategy development, that is untracked improvisation.
A simple repeatable sequence
- Load the strategy.
- Lock the date range.
- Run the base test.
- Change only one variable.
- Compare the new run to the prior one.
- Save the version notes.
Do that consistently, and your backtests stop being entertainment. They start becoming evidence.
A pattern test worth running
A clean setup can also be built around a named candlestick pattern. If you are testing the three black crows pattern, write the entry rule, the trend filter, and the exit rule before you run anything. That keeps the test tied to a defined setup instead of a loose market story.
The point is not to make the idea sound clever. The point is to make it testable in a way that survives comparison, reruns, and the kind of pressure that exposes weak assumptions.
Reading the Equity Curve Like a Risk Manager
Traders often stare at the ending balance and miss the story in the shape. The equity curve tells you how the strategy earns, how it loses, how long it stays underwater, and whether the gains come from a steady process or a single lucky burst.
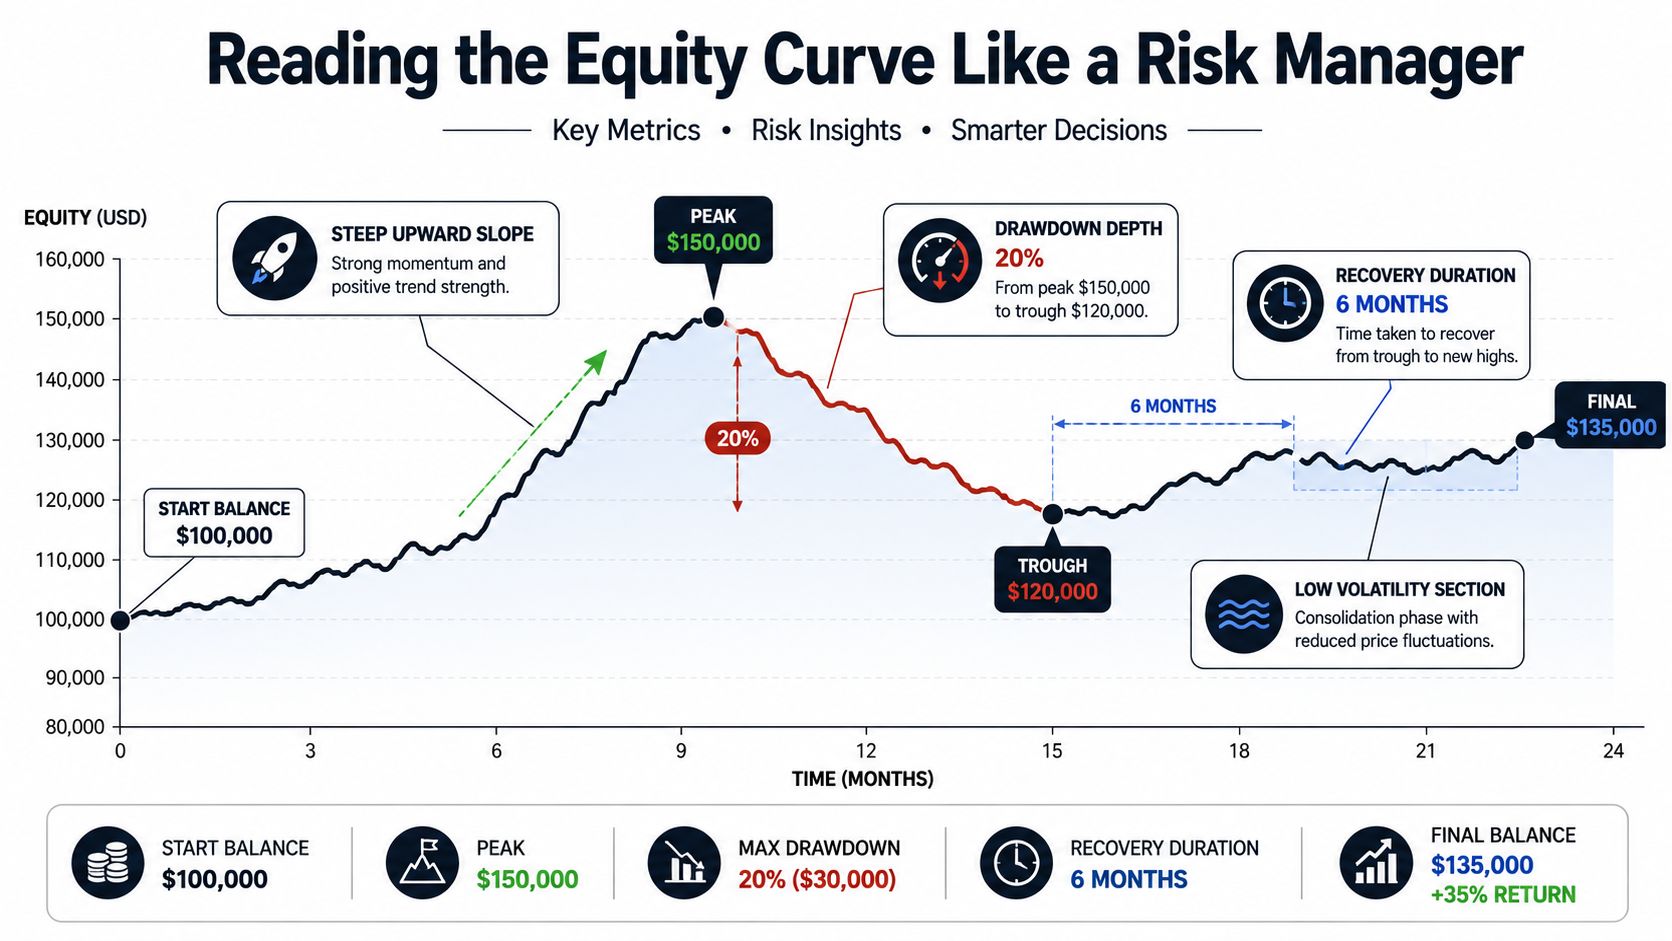
What the curve reveals before the numbers do
A smooth upward slope is usually easier to live with than a jagged climb powered by occasional spikes. A strategy that spends long stretches flat and then jumps suddenly can look strong on paper, but it often depends on a few outlier wins and tight assumptions. When the curve behaves like that, execution friction can change the story fast.
The same idea shows up in trade frequency. A system with a handful of big wins can mask a weak base rate, while a more stable system may look less exciting but be easier to scale and monitor. That's why I trust the curve shape before I trust the raw return.
A useful comparison is a reliable RSI pullback strategy versus an overfit Bollinger-band breakout. The reliable one usually shows a more consistent climb with manageable drawdowns, while the overfit version often looks sharp in the exact sample it was tuned on and far less convincing when the market changes. That difference is exactly why a backtest should be judged as a risk map, not a trophy.
The chart embedded in a backtest tells you where the pain lives, where recovery happens, and whether the strategy can survive a bad patch without structural damage. If the drawdowns are deep and slow to recover, the live version may be much harder to hold than the backtest suggests.
A quick risk-manager checklist
- Slope consistency: does the curve move in a broadly stable direction.
- Drawdown behavior: are losses controlled or severe.
- Recovery pattern: does the system recover through normal trading, or only through rare outlier wins.
- Flat periods: does the strategy go dormant for long stretches.
- Parameter dependence: does the curve require a narrow setting to look acceptable.
A backtest that only looks good when the settings are exact is telling you the market probably won't cooperate twice.
Extracting Truth From the Trade Log
The trade log is where the strategy stops being a story and becomes evidence. Aggregate profit can hide a lot, including whether the system wins cleanly, bleeds slowly, or survives only because one or two trades rescued the month.
What to record on every trade
The most useful logs capture entry price, exit price, entry and exit time, direction, position size, profit or loss in R-multiples, and maximum adverse excursion. One guide also recommends tagging market context, like whether the setup was trending, ranging, or pre-news, because that's often where the key pattern emerges (FXReplay backtesting guide). Without that context, two trades that look identical in the summary can behave very differently in practice.
Here's a simple way to think about the core fields:
| Metric | How to Calculate | What It Reveals |
|---|---|---|
| Entry and exit price | Record the fill prices for each trade | Whether execution matched the idea |
| Entry and exit time | Log the exact timestamps | Whether the setup depends on a certain session or volatility pocket |
| R-multiple | Profit or loss divided by initial risk | Whether the edge is consistent across trade size |
| Maximum adverse excursion | Track the worst unrealized move against the position | How much heat the trade can take |
| Market context | Tag trend, range, or pre-news conditions | Which regimes support the setup |
How the log exposes hidden weakness
A strategy that wins often but gives back gains on rare blowups looks better in a summary than it does in the raw trades. A system with many small losses and occasional big winners can be healthy, but only if the winner distribution is stable and the losers are controlled. The log makes those patterns obvious.
A practical review session starts with the R-multiples. If the trades cluster around a clean average and the losers don't dominate the downside, the setup may be viable. If most profits come from a tiny set of trades, the system is probably more fragile than the equity curve suggests.
That's also where expectancy, profit factor, and win rate become interpretable. Trade counts matter because a few dozen trades can easily mislead you, while a larger sample makes the distribution more useful. The log is the only place where the strategy's true personality shows up trade by trade.
Validating With Walk-Forward and Out-of-Sample Testing
A backtest without validation is just a fit to the past. The key test is whether the idea still works after the parameters and dates are pushed away from the exact conditions that produced the first attractive result.
The validation layer that catches curve fit
A positive historical curve is not the minimum bar. The idea has to survive out-of-sample validation, walk-forward analysis, and Monte Carlo resampling, with the core metrics staying stable before anyone trusts the in-sample return, as practical backtesting guidance explains (Goat Funded Trader backtesting best practices). That standard exists for a reason. Plenty of strategies look excellent until the trade order changes or the market regime shifts.
A clean validation workflow splits the history into in-sample and out-of-sample segments. The model is tuned on one section, then tested on unseen data. Walk-forward analysis takes that a step further by rolling the window forward, re-optimizing on each new block, and checking whether the result still holds.
Monte Carlo resampling adds another layer by testing whether the trade sequence itself is fragile. If the strategy falls apart when the order is shuffled or sampled differently, the equity curve is probably leaning too hard on luck. That matters because live trading will not deliver trades in the neat order your backtest used.
Practical trading guidance also points to logging 100+ trades across multiple market conditions before treating the metrics as meaningful (Goat Funded Trader backtesting best practices). Without that depth, a strong win rate can still be noise.
A clean in-sample curve is the start of the work, not the finish.
Why the numbers can split apart
One useful check is the gap between in-sample and out-of-sample results. A strategy that showed 40 percent in-sample return but only 3 percent out-of-sample was probably overfit. Another held up much better, with 18 percent in-sample and 14 percent out-of-sample. Those differences matter more than the raw gain, because they show whether the edge survived contact with new data.
That same discipline should carry into the stop placement rules, which is why it helps to review a practical guide on how to set stop loss levels before deciding whether the validation results are acceptable. A system that keeps most of its edge outside the training set is the one worth taking seriously.
From Backtest to Live Without Losing Money
The jump from tested idea to live capital is where good traders separate themselves from optimistic ones. A live rollout should be boring on purpose, because the goal is to discover execution problems while the downside is still small.
Phase the rollout and watch the friction
A phased rollout should start with 3 to 6 months or 50+ trades in paper trading before any meaningful capital goes live, and one source recommends moving to only about 1% of capital at first (TradeZella backtesting guide). That buffer gives you time to see whether fills, latency, and order handling line up with the backtest assumptions.
When the strategy moves live, compare every assumption against what happens. If slippage is worse, fills are partial, or latency changes the entry price, the backtest was too optimistic. The same logic applies to order rejection and execution delays, which should already have been stress-tested before deployment, as noted in the earlier backtesting guidance.
A practical pre-launch checklist should include these items:
- Costs modeled: commissions, slippage, and fill assumptions are explicit.
- Execution tested: live fills are close enough to the simulated ones.
- Regime coverage: the strategy was tested across multiple market conditions.
- Trade log ready: live trades are recorded in the same format as the backtest.
- Risk capped: initial capital use stays small until the process proves itself.
If you need a clear reference for stop placement before going live, the how to set stop loss guide is a useful companion to the rules you already tested.
The biggest mistakes are still familiar. Traders optimize on the test set, ignore funding rates, underestimate exchange downtime, or assume the backtest's fill quality will carry over unchanged. Those mistakes don't announce themselves with drama. They usually show up as slow bleed.
GeckoScreener gives you a way to screen crypto markets, define rules in plain language, and backtest those rules before you risk capital. If you want to compare indicator filters, stop-loss settings, and trade logs in one workflow, visit GeckoScreener and run a strategy against real historical crypto conditions instead of guessing from a chart.
GeckoScreener Team
Written for the GeckoScreener community. Join us on Telegram →
Related Articles


Start screening cryptocurrencies for free
Apply strategies like this one in real-time across 250+ coins.
Try GeckoScreener →