Metal Price Crypto: Tokenized Metals and Market Trends
Explore how metal price crypto markets work, from tokenized gold to metal-pegged stablecoins. Learn about trading strategies, data sources, and market dynamics.
GeckoScreener Team
Aug 19, 2026 · 14 min read
Updated about 2 months ago

Tokenized gold reached a $5.14 billion market capitalization on August 18, 2026, according to CoinGecko's tokenized-gold category data. That figure reframes “metal price crypto” from a niche search term into a market-structure question. The important issue isn't whether a token follows gold. It's whether traders can enter, exit, transfer, and hedge that exposure efficiently when liquidity fragments or positioning reverses.
Tokenized metals combine familiar commodity exposure with crypto-market mechanics. They offer continuous access, fractional ownership, and blockchain-based transferability, but they also introduce issuer concentration, custody dependence, exchange fragmentation, and liquidation risk. A price chart can show direction. It can't, by itself, show whether the next trade will execute near the displayed price.
Table of Contents
- The Rise of Tokenized Metals in Crypto Markets
- Types of Metal-Linked Crypto Assets
- Bitcoin and Gold Correlation Myths
- Liquidity and Execution Realities
- Downside Scenarios and Liquidation Risk
- Screening and Chart Pattern Analysis
The Rise of Tokenized Metals in Crypto Markets
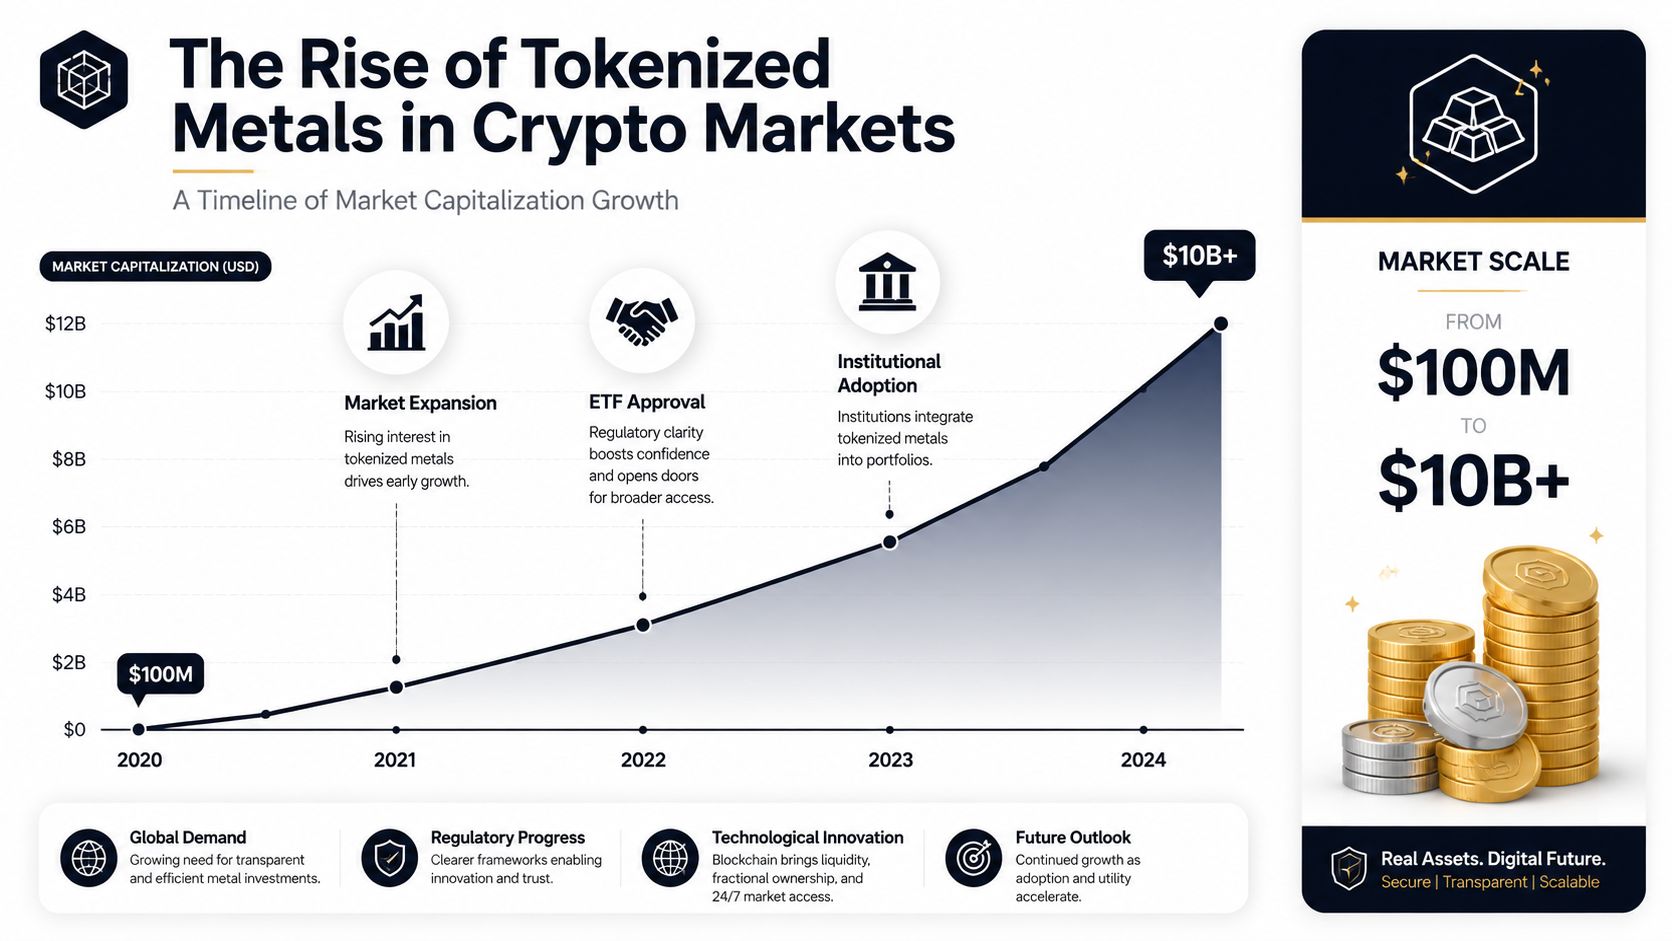
The tokenized-gold market recorded $178 billion in trading volume in 2025, including $126 billion in the final quarter, while its market capitalization rose 177% to more than $4.4 billion. These figures, summarized by CoinGecko's tokenized-gold category, show that tokenized metals have moved beyond a niche product class.
The market remains small beside the roughly $32 trillion global gold market. Its importance lies in the trading structure rather than scale alone. Blockchain instruments can trade continuously, support fractional positions, and move through crypto wallets and settlement rails. Those benefits also split liquidity across exchanges, wallets, and issuer-controlled redemption channels.
Why the wrapper changes the trade
A fully backed token generally represents a claim linked to physical metal held in custody. Its value should track the metal price, yet its execution depends on separate order books, settlement rules, and redemption terms. During a sharp move, uneven buyers and sellers can push the token away from reference spot prices. A chart may show the deviation only after available liquidity has already thinned.
Tokenization also lowers the practical size of a position. Fractional ownership gives traders gold exposure without handling a bar or using a conventional fund structure. Twenty-four-hour trading and on-chain transferability suit crypto-native participants, but continuous access does not guarantee continuous depth. A token may remain tradable while larger orders experience wider spreads or meaningful price impact.
Issuer concentration adds another layer. A small group of products can account for much of the category's activity, leaving holders exposed to custody, redemption, and operational decisions made outside the exchange. By early 2026, market summaries ranked tokenized gold as the second-largest real-world-asset category after tokenized treasuries, according to the CoinSwitch ranking and sector review. The ranking indicates adoption, not superior execution.
Practical rule: Treat the token and the metal as related markets with different failure points. Check venue depth, issuer concentration, custody terms, redemption mechanics, and spread behavior before sizing a trade.
The analytical question is whether tokenization improves access and settlement enough to justify those additional execution risks. Gold exposure can be familiar while the route used to obtain it remains fragmented, concentrated, and vulnerable during reversals.
Types of Metal-Linked Crypto Assets
Metal-linked crypto assets differ in legal structure, custody, settlement, and trading behavior. Treating them as one category obscures the risks that matter during execution. A token representing vaulted gold has a different claim structure from a synthetic contract that only references a metal price.
| Category | Example Tokens | Backing Mechanism | Redemption | Key Risk |
|---|---|---|---|---|
| Fully backed tokens | PAXG, XAUT | Physical gold held through issuer custody arrangements | Governed by issuer terms and eligibility requirements | Custodian, issuer, redemption, and market-liquidity risk |
| Metal-pegged stablecoins | Metal-linked designs | Algorithmic, reserve-based, or partially backed mechanisms | Depends on the protocol or issuer | Peg failure, reserve opacity, and smart-contract risk |
| Synthetic exposure tokens | Derivative-based metal products | Futures, swaps, or other financial contracts | Usually cash or token settlement rather than direct metal delivery | Counterparty, funding, roll, liquidation, and tracking risk |
Fully backed tokens have the clearest connection to physical gold, but that connection does not remove execution risk. Tether Gold, XAUT, and Pax Gold, PAXG, are the dominant examples in available market snapshots. A CoinSwitch market ranking from February 2026 placed XAUT at about $2.59 billion and PAXG at about $2.3 billion. The same review describes a category whose value is concentrated in its leading products.
Concentration affects trading as much as ownership. Larger tokens may offer deeper secondary-market liquidity, while smaller products can show wider spreads, thinner order books, and greater price impact for the same order size. Concentration also ties holders to a limited group of issuers, custodians, smart contracts, and exchange integrations. A change in redemption procedures or the loss of liquidity on one venue may leave few practical substitutes.
Metal-pegged stablecoins create a different exposure. Their target is a metal-linked price, but the peg may depend on reserves, incentives, algorithms, or a combination of mechanisms. During a sharp reversal, traders may price confidence in the design rather than the metal itself. Reserve uncertainty and limited exit liquidity can therefore turn a tracking instrument into a de facto credit or protocol-risk position.
Synthetic exposure tokens are derivatives in token form. They can follow a reference price without giving the holder ownership of a bar. Returns may depend on collateral quality, funding costs, contract rolls, liquidation rules, and counterparty solvency. Fragmented venues can add another layer of slippage when positions are closed under stress.
Screening should begin with ownership and settlement, not chart performance: what does the holder legally or contractually possess, where can it be traded, and what happens during redemption, a venue outage, or a fast reversal? Those answers determine whether the asset behaves like vaulted commodity exposure, a metal-pegged stablecoin, or an amplified macro position.
Bitcoin and Gold Correlation Myths
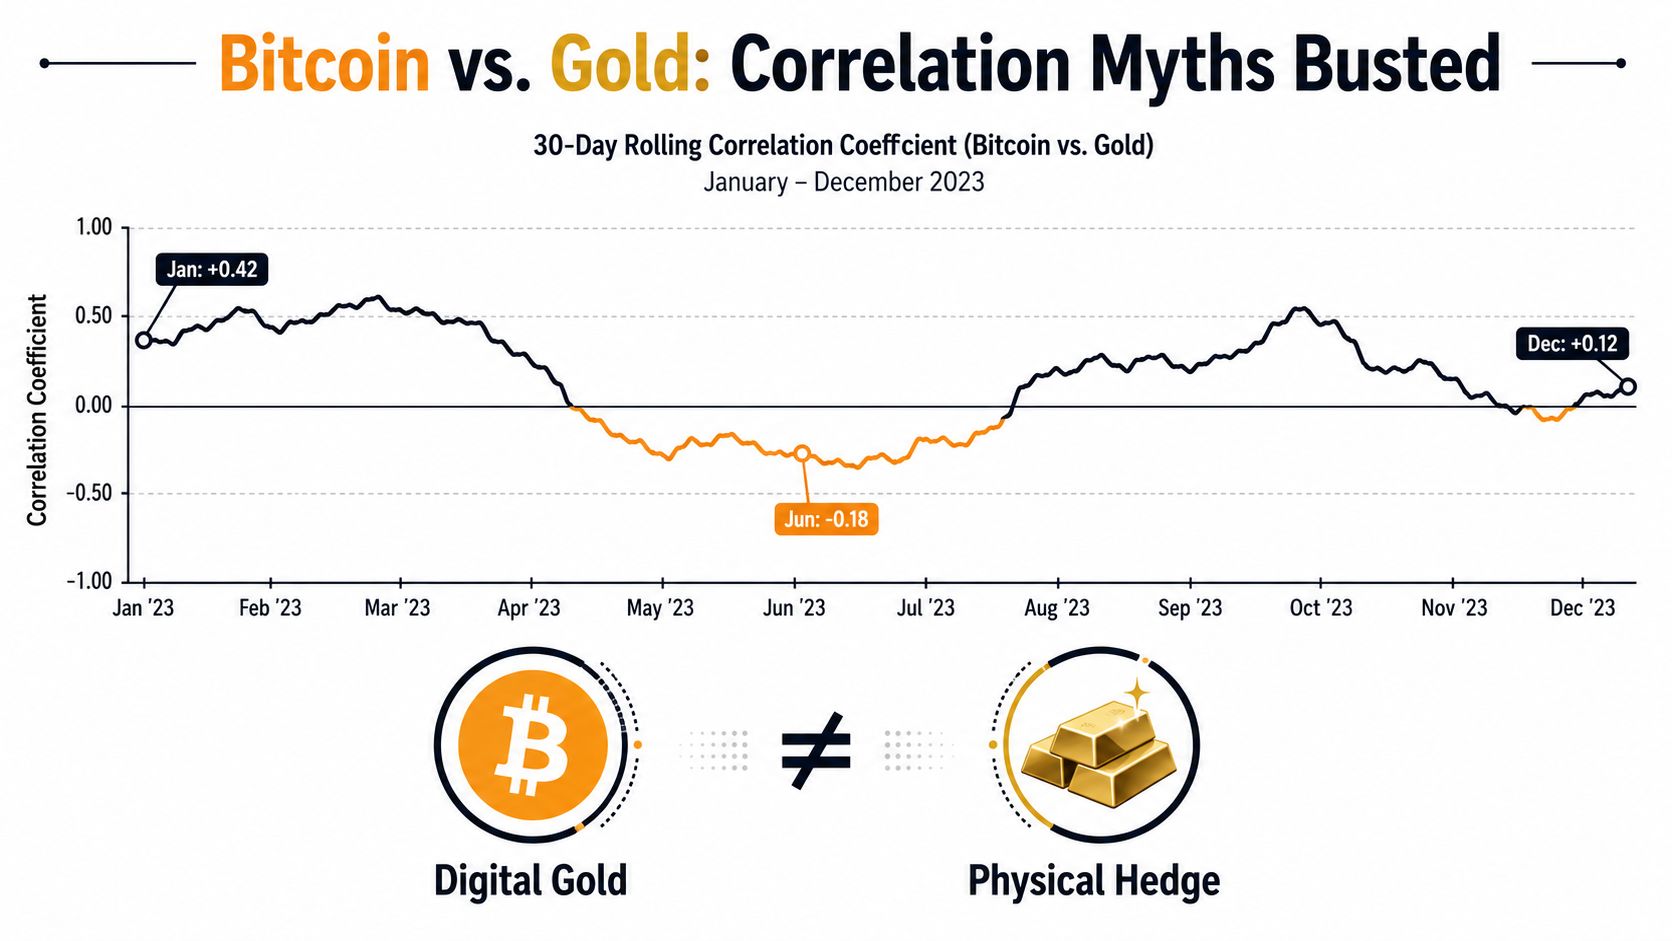
Bitcoin and gold are often grouped together as scarce assets, but their return relationship isn't stable enough to support a permanent hedge assumption. NYDIG reports that Bitcoin's 90-day rolling correlation with gold has ranged from +0.57 to -0.37 and averaged about 0.10 since 2015, as documented in its analysis of Bitcoin and gold drivers. A separate academic study found no statistically significant correlation and no long-term cointegration between the two markets, also summarized in that source.
Why the average can mislead
An average correlation compresses multiple market regimes into one number. Bitcoin may respond strongly to liquidity conditions, risk appetite, and forced deleveraging, while gold may respond to monetary credibility concerns, defensive demand, or geopolitical stress. Those drivers can overlap for a period, then separate abruptly.
That behavior creates a familiar trap for pairs traders. A BTC-gold spread can appear to mean-revert for a long stretch, encouraging a trader to assume that divergence will eventually close. If macro liquidity changes, the relationship can break instead. The spread may continue widening while a strategy based on full-period correlation interprets the move as an opportunity.
Correlation is a measurement window, not a permanent economic relationship.
Rolling analysis is more appropriate than a single long-run coefficient. A trader can monitor whether the relationship is strengthening, weakening, or changing sign, then test whether the signal remains useful after accounting for transaction costs and execution conditions. The purpose isn't to find a magical hedge ratio. It's to identify when the relationship has stopped behaving as expected.
Implications for tokenized gold
Tokenized gold inherits the metal's price exposure, but its presence in crypto markets can bring additional common risk with Bitcoin. During broad crypto stress, traders may sell liquid positions to raise cash, even if the underlying gold thesis remains intact. That can create temporary divergence between tokenized gold and physical-market benchmarks.
The result is a more limited conclusion. Tokenized gold may diversify a crypto portfolio in some regimes, but it shouldn't be treated as a guaranteed offset to Bitcoin drawdowns. The evidence supports a regime-dependent relationship, not a stable “digital gold versus physical gold” pairing. Any BTC-gold strategy needs rolling validation and explicit attention to liquidity, not just a historical correlation average.
Liquidity and Execution Realities
A token can track gold accurately and still deliver poor execution. The displayed price is only one part of a trade. A trader also needs sufficient bids and offers, reliable market depth, manageable slippage, and a venue that remains active when volatility rises.

The hidden cost of fragmented liquidity
Tokenized metals can trade across multiple exchanges and blockchain environments. Those pools don't necessarily share the same participants, inventory, fee structure, or market-making capacity. A quote on one venue may look attractive until the trader discovers that the available size is limited or that transferring the asset introduces delay and cost.
The problem becomes more visible during a sharp move. A market order consumes the best available offers or bids in sequence. If the order book is thin, the average fill can differ materially from the first displayed quote. A trader who evaluates only the last price may underestimate the cost of both entry and exit.
Issuer concentration adds another layer. Available market snapshots show that XAUT and PAXG dominate the category, while market coverage has described tokenized-gold volume as exceeding most exchange-traded funds during the 2026 metal rally. That activity may indicate genuine crypto-native utility, but it may also reflect speculative positioning concentrated in a few instruments. The volume alone doesn't reveal how much was executed near the midpoint, how much came from traders using debt, or how resilient the books were during reversals.
A practical execution checklist
Before trading a metal-linked token, examine:
- Venue depth: Compare the visible bid and offer size across the venues you can access.
- Spread behavior: Watch whether the spread remains orderly during active metal sessions and crypto volatility.
- Order type: Use limit orders when market depth is uncertain, and avoid assuming that a reference price guarantees a fill.
- Transfer path: Confirm that deposits, withdrawals, and wallet compatibility won't create an operational bottleneck.
- Issuer exposure: Identify whether several venues ultimately depend on the same issuer and custody structure.
A comparison of crypto trading platforms can help traders evaluate venue functionality, but platform selection doesn't remove instrument-level risk. The execution decision still belongs to the trader.
The right benchmark isn't whether a token mirrors spot gold. It's whether the token provides usable liquidity at the moment a position must be opened or closed. That standard separates tokenization as a settlement innovation from tokenization as a reliable trading vehicle.
Downside Scenarios and Liquidation Risk
Gold exposure can look defensive until a trader adds borrowed funds, crowded positioning, and crypto-market liquidation mechanics. At that point, the relevant risk isn't just a falling metal price. It's the interaction between a sharp reference-market reversal and forced selling in a digital venue.
Reuters reported that gold reached a record $5,594 before suffering its largest single-day drop since 1983, a reversal that could test the fast-growing gold-token market, as described in its report on precious-metal price fluctuations. CoinDesk also reported that a January 2026 pullback in gold, silver, and copper triggered about $120 million in liquidations tied to tokenized metals, according to the same verified market-risk coverage.
Those events challenge the idea that tokenized metals automatically behave like stable stores of value. The underlying metal may be less volatile than many crypto assets, but a token position can still be liquidated quickly. Forced selling can push market prices below an orderly reference value, particularly when several participants hold similar directional positions.
What traders should stress-test
A downside review should ask:
- How far can the metal move before collateral becomes insufficient?
- Does the venue liquidate at market, and how much depth is available below the position?
- Can the token be redeemed during a disorderly market, or is secondary-market liquidity the only exit?
- Would a crypto-wide selloff create additional selling even if gold's fundamental outlook remains constructive?
Risk distinction: Physical backing may reduce one form of asset risk. It doesn't eliminate market, custody, counterparty, leverage, or execution risk.
Issuer due diligence also matters. A token can fail to provide the expected exposure through a weak peg, unavailable redemption, custody disruption, or contract vulnerability. Those are distinct from a conventional price decline, so traders shouldn't combine them into one generic “volatility” assumption. A basic explanation of what a rug pull is can clarify why issuer and contract checks matter, even when a project markets itself around a real-world asset.
The practical conclusion is uncomfortable but useful. Tokenized metals can serve as accessible commodity exposure, yet tokenized-metal trades may behave like macro risk positions during stress. Position sizing, liquidation distance, and exit liquidity deserve as much attention as the direction of gold or silver.
Screening and Chart Pattern Analysis
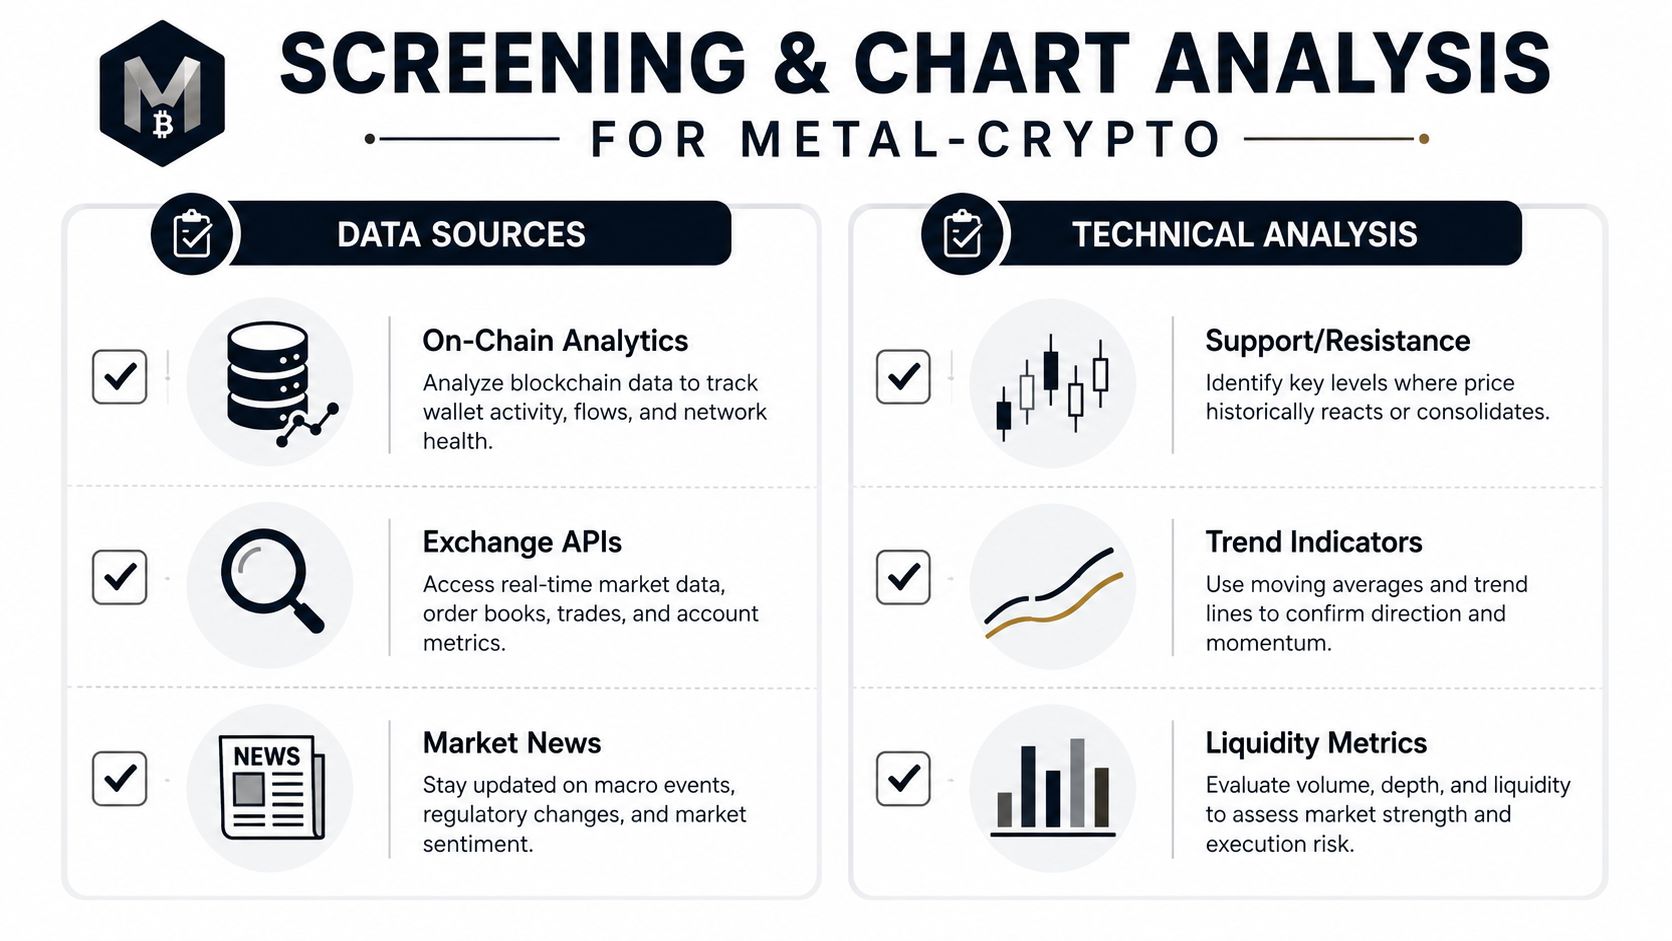
Technical analysis has value only when price behavior is tested against execution conditions. A rising chart does not establish deep liquidity, and a breakout on one venue may fail when prices converge elsewhere. Screening should therefore combine price, volume, market structure, venue depth, and issuer information before a setup is treated as actionable.
Build the screen around tradability
Begin with major gold-backed tokens and silver or industrial-metal products that satisfy custody and redemption requirements. Compare each token with a relevant metal reference, then check for premiums, discounts, and price gaps between venues. Issuer concentration matters because a single redemption process or custodian can become a bottleneck during a reversal.
A practical screen can include:
- Volume expansion: Look for a clear increase relative to the asset's own recent activity. Then determine whether volume is distributed across venues or concentrated in one thin order book.
- Momentum filters: RSI, MACD, and ADX can classify momentum. None measures redemption availability, issuer exposure, or order-book depth.
- Price structure: Mark support and resistance zones formed by concentrated trading activity. Record whether those levels hold consistently across venues.
- Candlestick signals: Doji, Hammer, engulfing, and rejection candles can indicate hesitation or failed continuation. Confirmation requires follow-through, adequate depth, and execution prices that remain close to the displayed market.
The crypto chart-reading guide offers background on candles and trend structure. For metal-linked assets, the more important question is whether a pattern appears across several venues or only on one fragmented market.
Named patterns, applied carefully
A head and shoulders formation may show that an advance is losing structure, particularly when a neckline break coincides with expanding sell volume. A triangle signals compression before a possible directional move, but fragmented liquidity can create false breakouts or prints that are difficult to execute.
A double top becomes more informative when a token tests resistance twice, fails, and the reference metal also weakens. A double bottom may indicate defended support, although temporary withdrawal of offers or bids can imitate genuine demand. The distinction becomes harder during sharp reversals, when displayed liquidity can disappear before an order reaches the book.
Flags and wedges help define trend, consolidation, and invalidation levels. Examples of head and shoulders, triangles, flags, double tops and bottoms, and wedges appear in this crypto chart-pattern guide. Images support recognition, but a trade still needs explicit entry, exit, and risk rules.
The platform does not yet provide trading or backtesting features. Backtesting and alerts will be live very soon. Until then, document each setup manually, record the reference-metal move, compare venue prices, and note the spread at entry and exit. That record can show whether an apparent edge came from a repeatable pattern or one favorable liquidity condition.
GeckoScreener helps traders screen crypto markets, compare indicator and candlestick conditions, and organize metal-linked assets for review. Visit GeckoScreener to monitor potential setups with closer attention to price structure, liquidity, and execution risk.
GeckoScreener Team
Written for the GeckoScreener community. Join us on Telegram →
Related Articles



Start screening cryptocurrencies for free
Apply strategies like this one in real-time across 250+ coins.
Try GeckoScreener →