Three Black Crows Pattern: When the Trend Has Already Turned
The three black crows pattern is three sessions of seller control, not a warning. The recognition rules, the context filters, and when it is worth shorting.
GeckoScreener Team
Apr 1, 2026 · 7 min read
Updated about 1 month ago
Quick Summary
- Three consecutive red candles, each opening within the prior body and closing progressively lower.
- Each closes near its session low with minimal lower wick, so buyers could not push back in any session.
- At the top of an uptrend: a strong reversal. Three sessions of selling say the bull trend is breaking.
- After a gap up or a parabolic move: the blow-off top is complete.
- On daily and weekly charts: the most reliable version by a distance.
- Strength: 85/100.
Pattern Anatomy
BearishSignal
BearishStrength
Structure
3 candles · Reversal
Best timeframe
1D · 1W
Key rule
3 consecutive red candles, each opening within prior body and closing lower.
Three sessions. Three red candles. Each opens within the prior candle's body, each closes lower, and each finishes near its session low with barely any lower wick.
The three black crows pattern does not signal that sellers might be gaining control. It shows they have already had it for three full sessions.
The important part is not the colour. It is the sequence. Sellers kept control across three sessions rather than landing one isolated hit, and that persistence is what separates this from a sloppy pullback.
What the Three Black Crows Pattern Is
It is the exact mirror of three white soldiers.
Candle 1: a bearish candle appearing in or after an uptrend.
Candle 2: opens within candle one's body, closes lower than candle one, and carries minimal lower wick.
Candle 3: opens within candle two's body, closes lower again, and finishes near its session low.
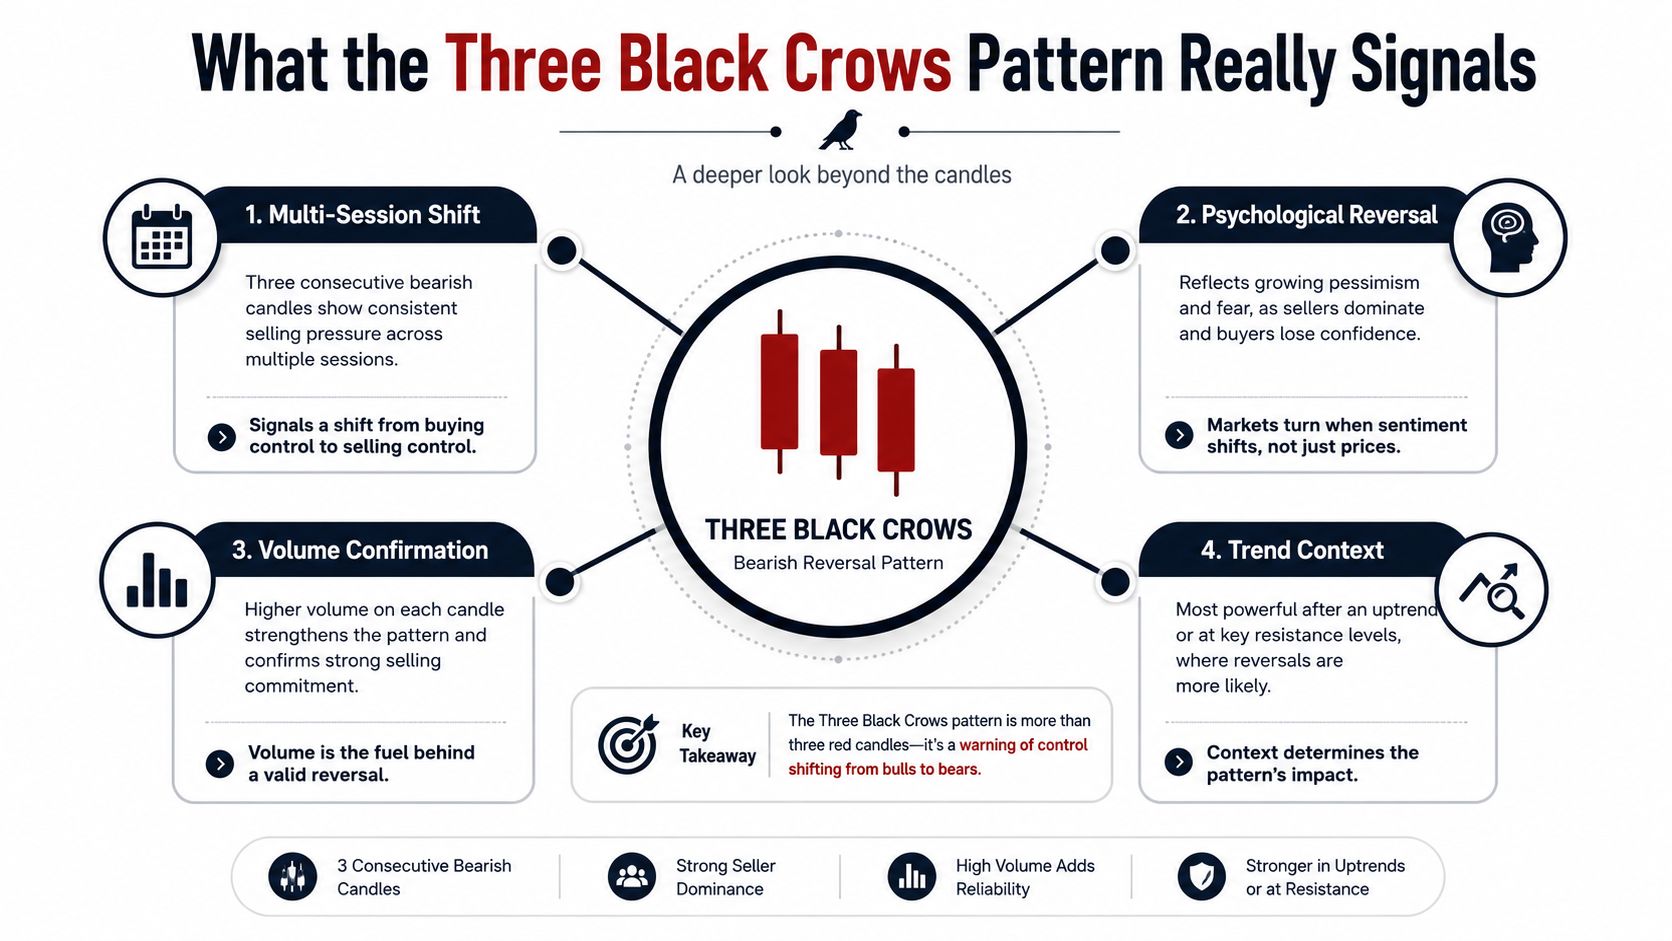
Formation rules:
- Three consecutive bearish candles, each long-bodied
- Each opens within the prior real body, so no large gaps
- Each closes progressively lower, with the third closing below the second's close
- Minimal lower wicks, because buyers could not push back
- Bodies roughly similar in size
- Context: after an uptrend or rally
Those details matter more than they look. They are what separate a strong directional sequence from three ordinary red days.
The Psychology
Three sessions where sellers systematically took price lower without meaningful pushback.
That "within the prior body" opening carries most of the weight. It shows steady, persistent selling rather than a panic gap or a one-time event. Sellers were in control consistently, session after session.
The minimal lower wicks say something blunter. Buyers tried to push back in every one of those sessions and could not, and every session closed near its low. That is a market in systematic decline rather than a market having a bad day.
In crypto, three black crows on the daily chart can mark the start of a multi-week or multi-month bear move. They usually appear near the beginning of a trend change rather than at the absolute peak, often 5% to 10% below it, once the initial drop has already started.
Reliability, and Why Context Beats Geometry
Three black candles on their own do not give you a dependable trade. That is the uncomfortable part.
The pattern becomes useful when it appears after a strong rise, at resistance, with volume that supports the move. One trading reference cites roughly 75% to 80% bearish-direction reliability when three black crows appears at significant resistance with high-volume confirmation (Alchemy Markets). Read that carefully: the number is attached to the context, not to the shape.
A stricter validation style looks for the pattern after a rising market near major resistance, near a round number, or with RSI above 70, while watching for rising volume from the first candle to the third (FBS Academy). Treat those as context checks rather than rigid laws. They help you decide whether the candles are happening somewhere meaningful or in the middle of random price action.
What weakens it
Shrinking bodies across the three candles. Long lower wicks, which mean buyers were fighting back. Low or falling volume into the third candle. No prior uptrend to reverse. Any of those turn a high-conviction sequence into three red days that happened to line up.
Where It Appears Decides What It Means
At the top of an uptrend, highest conviction
Three consecutive red sessions after a sustained bull run say the party is over, and that it has been over for three days. The reversal is not happening, it has happened.
The more extended the prior uptrend, the more this matters. Three red candles after a five-day rally are not the same event as three red candles after a three-month bull move.
After a gap up or a parabolic move
Here it signals a blow-off top. The gap attracted retail buyers and the three crows are larger sellers distributing into that excitement. This is the strongest version of the pattern.
Mid-trend, during an otherwise healthy uptrend
This may be a significant pullback rather than a reversal. Check the larger structure. If higher lows are intact and price is above its key moving averages, this is more likely a dip than a trend change.
How to Trade It
Entry: short the close of the third candle, or the open of the fourth session.
Stop loss: above the high of the first candle in the sequence. If price reclaims that level, the reversal has failed.
Take profit: previous support, a Fibonacci retracement, or a measured move equal to the height of the three-candle pattern.
Volume: consistent or rising volume across the three candles strengthens the case. A third candle on notably lower volume than the first suggests selling momentum is already fading.
The warning worth repeating: by definition, price has already moved a long way. Shorting after three full red sessions often means arriving once the easy money is gone, which is the most common way this pattern loses people money. Partial entries, and adding on bounces rather than into the hole, handle that better than a single full-size entry.

The way to settle whether this works on the coins you actually trade is to define the rules first, then test them: the pattern conditions, the context filters, the entry, the stop and the exit, all in the same test. This backtesting guide covers doing that without fooling yourself, and the complete guide to GeckoScreener shows how to combine a screen, rules and a backtest in one place.
Three Black Crows vs Three White Soldiers
| Attribute | Three White Soldiers | Three Black Crows |
|---|---|---|
| Direction | Bullish | Bearish |
| Context | Bottom of downtrend | Top of uptrend |
| Body type | Three green | Three red |
| Wicks | Minimal upper wick | Minimal lower wick |
| Strength | 85/100 | 85/100 |
Identical structure, mirrored logic.
Live Three Black Crows Scanner
Open full screen ↗Switch timeframes (1H · 4H · 1D · 1W) to see which coins are showing this pattern right now.
GeckoScreener Team
Written for the GeckoScreener community. Join us on Telegram →
Related Articles
Start screening cryptocurrencies for free
Apply strategies like this one in real-time across 250+ coins.
Try GeckoScreener →