#three black crows pattern#candlestick patterns#crypto trading#bearish reversal#technical analysis

Three Black Crows Pattern: A Crypto Trader's Guide

Master the three black crows pattern in crypto trading. Learn recognition rules, reliability stats, sample trades, and how to backtest the setup.

G

GeckoScreener Team

Jul 25, 2026 · 14 min read

Updated about 20 hours ago

Three Black Crows Pattern: A Crypto Trader's Guide

Most traders learn the Three Black Crows pattern as a simple picture, three red candles after an uptrend, then they treat it like a sell signal. That's too shallow. The real question is whether those candles show a multi-session transfer of control from buyers to sellers, with the bodies, opens, closes, and trend context all lining up in a way that actually deserves a trade.

The difference matters because this pattern isn't just about color. It's about geometry, trend location, and follow-through. If you can read those three pieces cleanly, you stop chasing every red sequence on a chart and start separating textbook shapes from setups with a real chance of working.

Table of Contents

<a id="what-the-three-black-crows-pattern-really-signals"></a>

What the Three Black Crows Pattern Really Signals

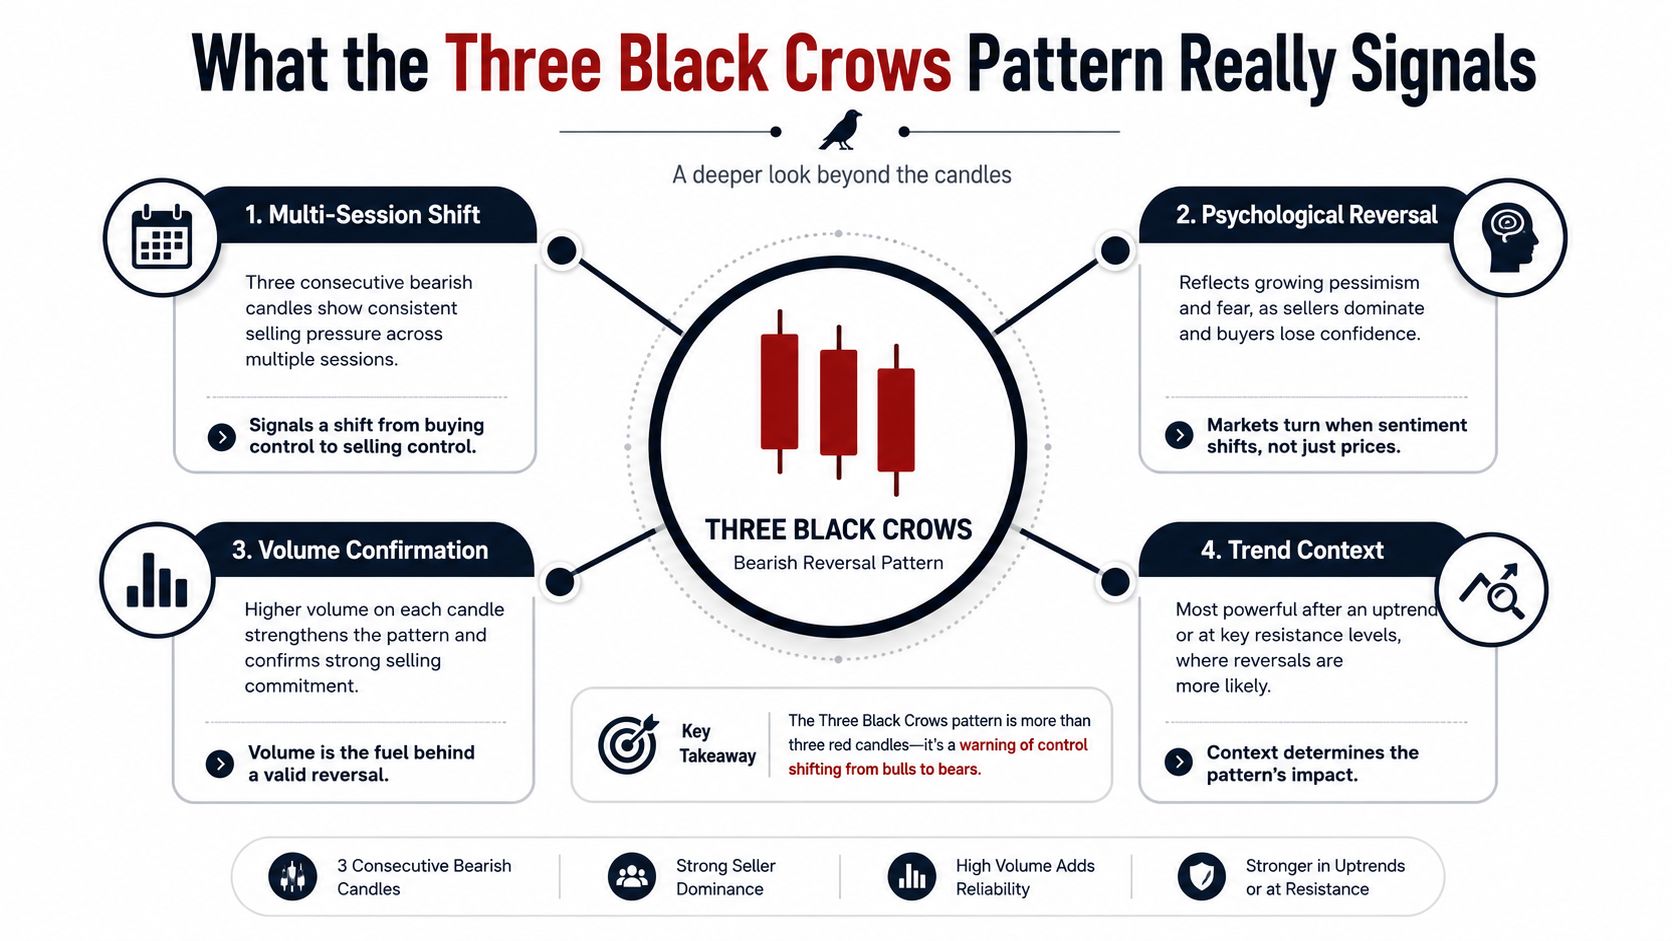
The Three Black Crows pattern is a bearish reversal structure made of three consecutive long-bodied bearish candles that appear after an uptrend. The important part is not the color alone, it's the sequence. Each candle opens within the prior candle's real body, then closes progressively lower, ideally near the session low, which tells you sellers kept control across three sessions instead of landing one isolated hit. That basic structure is described in detail by pattern references from Thomas Bulkowski's pattern notes and WH SelfInvest's technical breakdown.

An infographic explaining the Three Black Crows candlestick pattern and its significance in market trend analysis.

<a id="the-psychology-behind-the-candles"></a>

The psychology behind the candles

The pattern matters because it shows pressure over time, not just a sudden drop. Buyers defended the trend early, then failed to regain control as each candle opened inside the prior body and closed lower, which signals that demand was fading while supply kept pressing in. Bulkowski's description also emphasizes that the candles should be “tall” relative to recent price action, meaning taller than the average candle height over the prior week or two, so the pattern stands out from ordinary noise rather than blending into normal volatility.

A lot of traders confuse a few red candles with this setup. That's a mistake. The pattern isn't saying, “price went down.” It's saying, “the prior bullish advance lost control in a structured, repeated way.”

📌

Practical rule: If you can't point to the prior uptrend, the candle overlap, and the lower closes, you're not looking at a clean Three Black Crows pattern.

<a id="the-traders-job"></a>

The trader's job

The pattern gives you three jobs. First, identify the structure without forcing it. Second, check whether the context gives it trading value. Third, validate whether your own market and timeframe reward the setup.

If you want a mirror image for comparison, the bullish counterpart is covered in this related Three White Soldiers guide. That comparison helps because the two patterns are structurally similar, but the market meaning is opposite. One shows sellers taking over after strength, the other shows buyers doing the same after weakness.

<a id="anatomy-and-recognition-rules"></a>

Anatomy and Recognition Rules

<a id="build-the-pattern-candle-by-candle"></a>

Build the pattern candle by candle

Start with the prior trend. The pattern needs an established uptrend, not a flat patch or a messy range. If price has just been drifting sideways, three bearish candles can mean almost anything, and the reversal message gets weak fast. The setup is most technically valid after a rally, because the pattern is really a shift after strength, not an isolated bearish pause.

Then examine the three candles themselves. Each one should be long-bodied, each should open within the real body of the prior candle, and each should close lower than the one before it. Some references also note that the bodies should be approximately equal in size, with small or no wicks, and the third candle should close below the second candle's close to complete the pattern, as summarized by Strike.money's recognition guide. Those details matter because they separate a strong directional sequence from a sloppy pullback.

Here's the cleanest way to read it in real time:

  1. Candle one breaks the bullish rhythm.
  2. Candle two shows sellers can press lower again.
  3. Candle three confirms that buyers still haven't wrestled back control.

<a id="context-filters-that-improve-the-setup"></a>

Context filters that improve the setup

A stricter validation style looks for the pattern after a rising market near major resistance, a round number, or with RSI above 70, while also watching for rising volume from the first candle to the third. That filter set comes from FBS Academy's pattern guide. I'd treat those as useful context checks, not rigid laws. They help you decide whether the candles are happening at a meaningful location or just in the middle of random price action.

📌

If the bodies shrink, the lower shadows get long, or the candles fail to keep stepping lower, the pattern gets weaker fast.

A helpful comparison is to line up valid structure against common look-alikes:

CriterionValid Three Black CrowsPullback in UptrendBearish Three Inside Down
Prior trendClear uptrendUptrend still intactUsually follows weakness or reversal pressure
Candle bodiesLong-bodied bearish candlesMixed bodies, often less forcefulFirst candle often bullish or mixed before bearish follow-through
OpensEach opens within prior real bodyOften gaps or opens awkwardlyMore mixed, less clean overlap
ClosesEach closes progressively lower near lowsOften stalls or bouncesBearish follow-through may be present, but structure is different
WicksSmall or minimal wicksLower shadows can be noticeableWicks often matter less than the reversal sequence

For a quick contrast with a different bearish reversal idea, traders often compare this pattern with bearish engulfing structure, but the Three Black Crows is more about three-session persistence than a single engulfing event.

<a id="reliability-and-why-context-beats-geometry"></a>

Reliability and Why Context Beats Geometry

Three black candles alone don't give you a dependable trade. That's the uncomfortable truth. The pattern becomes more useful when it appears after a strong rise, at resistance, and with volume that supports the move. One independent trading reference cites an approximate 75–80% bearish-direction reliability when Three Black Crows appears at significant resistance with high volume confirmation, which is exactly why you should demand context instead of reacting to candle color alone, as discussed in Alchemy Markets' pattern note.

<a id="what-weakens-the-signal"></a>

What weakens the signal

The pattern loses force when the candles show long lower shadows, when the bodies keep shrinking, or when the prior trend was never really strong. Those failures usually mean buyers pushed back into the close or that sellers didn't have enough control to force a decisive breakdown. In other words, the visual shape can still look right while the market message is wrong.

That's why intraday charts are tricky. They print more frequent false positives because noise, liquidity shifts, and short-term mean reversion can create a three-candle sequence without any meaningful trend change. The chart may look dramatic on a small timeframe, but if it isn't anchored to a real rally or a meaningful resistance area, the edge tends to fade.

<a id="the-real-question-traders-should-ask"></a>

The real question traders should ask

The useful question isn't, “Did I spot three red candles?” It's, “Does this setup have trend context, volume support, and enough follow-through potential to justify a short?” That framing lines up with the caution found in Investopedia's discussion of the pattern, which highlights the common problem with candlestick lore, the visual rule is easy, but the expectancy is usually the hard part.

📌

Practical rule: A pattern is a candidate, not a verdict. Treat it like a setup that still needs confirmation from context.

A separate way to say it is this. The geometry tells you what happened. The context tells you whether it matters. The timeframe tells you how much noise you're fighting.

<a id="three-crypto-chart-examples-that-show-the-pattern-in-action"></a>

Three Crypto Chart Examples That Show the Pattern in Action

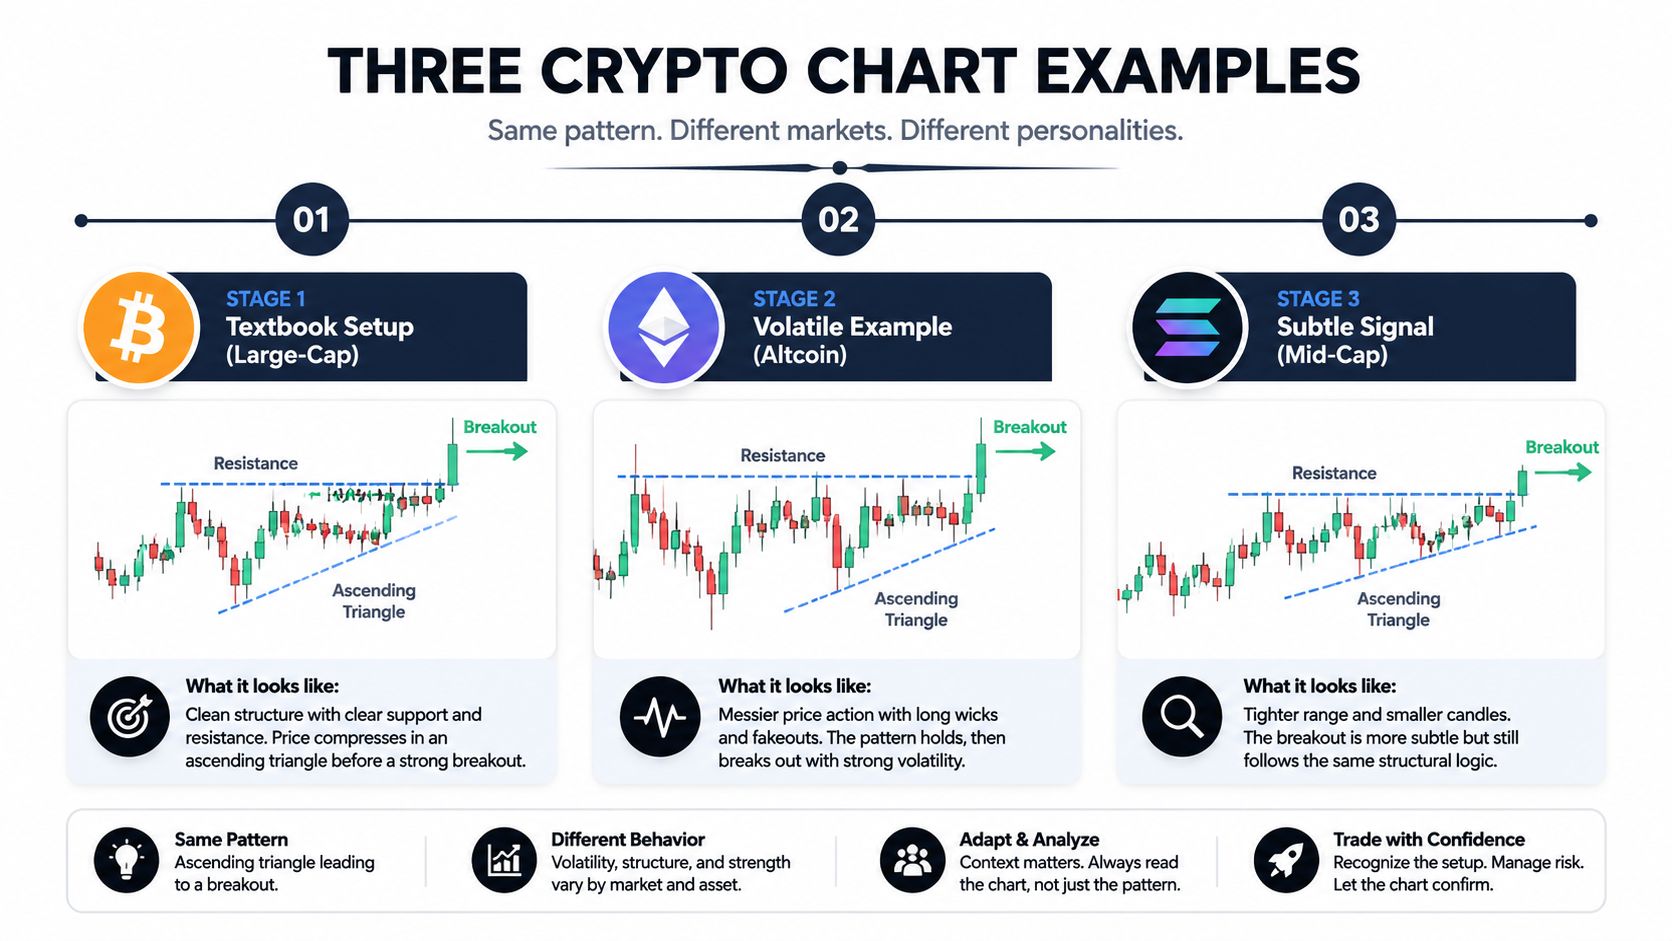
The best way to learn this pattern is to compare a clean setup, a failure, and a stronger version near resistance. Crypto makes that comparison useful because the same candles can mean very different things depending on whether the market is trending or chopping.

An educational infographic comparing three crypto chart examples of the ascending triangle pattern across different market assets.

<a id="textbook-setup-in-a-large-cap-coin"></a>

Textbook setup in a large-cap coin

The cleanest version starts after a mature uptrend in a large-cap coin. Price pushes higher for several sessions, then prints three clean, long-bodied bearish candles that open inside the prior bodies and close near their lows. RSI is already high, volume expands into the third candle, and the next sessions keep grinding lower instead of snapping back.

That is the version traders want. You don't buy the candle shape itself, you sell the failed bullish continuation that the shape reveals. In that case, a short entry on confirmation, or a measured retest after the third candle, makes sense because the market has already shown sustained seller control.

<a id="false-positive-in-a-choppy-altcoin"></a>

False positive in a choppy altcoin

Now flip to a smaller altcoin that's been moving sideways. Three bearish candles may still appear, and a beginner might call that Three Black Crows, but the prior trend is weak and volume doesn't expand. Price loses momentum, then chops sideways instead of breaking cleanly lower.

That's a false positive. The structure may look close enough on a screenshot, but the market didn't come from a strong enough rise, and sellers didn't prove they could keep control. In a case like that, the only good decision is usually no trade.

<a id="strong-version-near-resistance-on-the-daily-chart"></a>

Strong version near resistance on the daily chart

The most convincing version shows up near a major resistance zone on the daily timeframe after an extended rally. Price tests the area, rejects it, and the three bearish candles appear with cleaner lower closes and enough follow-through to show that buyers are backing off. The daily context matters because it reduces some of the random intraday noise and forces the pattern to compete against a meaningful level.

📌

Trading takeaway: In crypto, the pattern gets stronger when it's tied to a visible level and weaker when it's just three red candles floating in the middle of a range.

<iframe width="100%" style="aspect-ratio: 16 / 9;" src="https://www.youtube.com/embed/ul34Jfh-LOk" frameborder="0" allow="autoplay; encrypted-media" allowfullscreen></iframe>

<a id="backtesting-the-pattern-with-geckoscreener"></a>

Backtesting the Pattern With GeckoScreener

The fastest way to stop arguing with yourself about this pattern is to test it on your own watchlist. GeckoScreener is one platform that combines crypto screening, pattern detection, and historical backtesting in one place, with support for the top 100 crypto assets, indicator filters, candlestick detectors, and backtests over up to nine months across those coins. Its product description also notes data refreshes every 60 seconds and a screen for pattern-based filtering, which makes it relevant for traders who want one workflow instead of separate tools.

<a id="a-simple-no-code-testing-workflow"></a>

A simple no-code testing workflow

Start by screening for assets that match the Three Black Crows pattern and add an RSI-over-70 condition plus proximity to a resistance level. That gives you a narrower candidate set than raw candlestick scanning. Then run the historical test across the available window and compare the equity curve against the individual trade log, because the curve shows the broad shape of the strategy while the trade list shows where it is failing.

The article walkthrough in GeckoScreener's complete guide is useful here because it shows how a no-code strategy flow can combine screen, rules, and backtest in one place. You don't need to treat that platform as a magic answer. You do need a repeatable method that keeps the pattern rules, the filters, and the outcome in the same test.

<a id="define-the-trade-rules-before-you-test"></a>

Define the trade rules before you test

Use one clear entry rule, one clear stop, and one clear target. A common short entry is the close of the third candle or the next session open. A common stop is above the first candle's high or the prior swing high. A common target is a fixed risk-reward multiple or a percentage move to nearby support.

If the equity curve is flat or choppy, that usually means your filters are too loose or the pattern is being tested in the wrong regime. Tighten the prior trend filter, require cleaner candle bodies, or test only the higher timeframes first. The point isn't to rescue a weak idea, it's to discover whether the setup has a repeatable edge on the assets you trade.

<a id="trading-checklist-before-you-click-sell"></a>

Trading Checklist Before You Click Sell

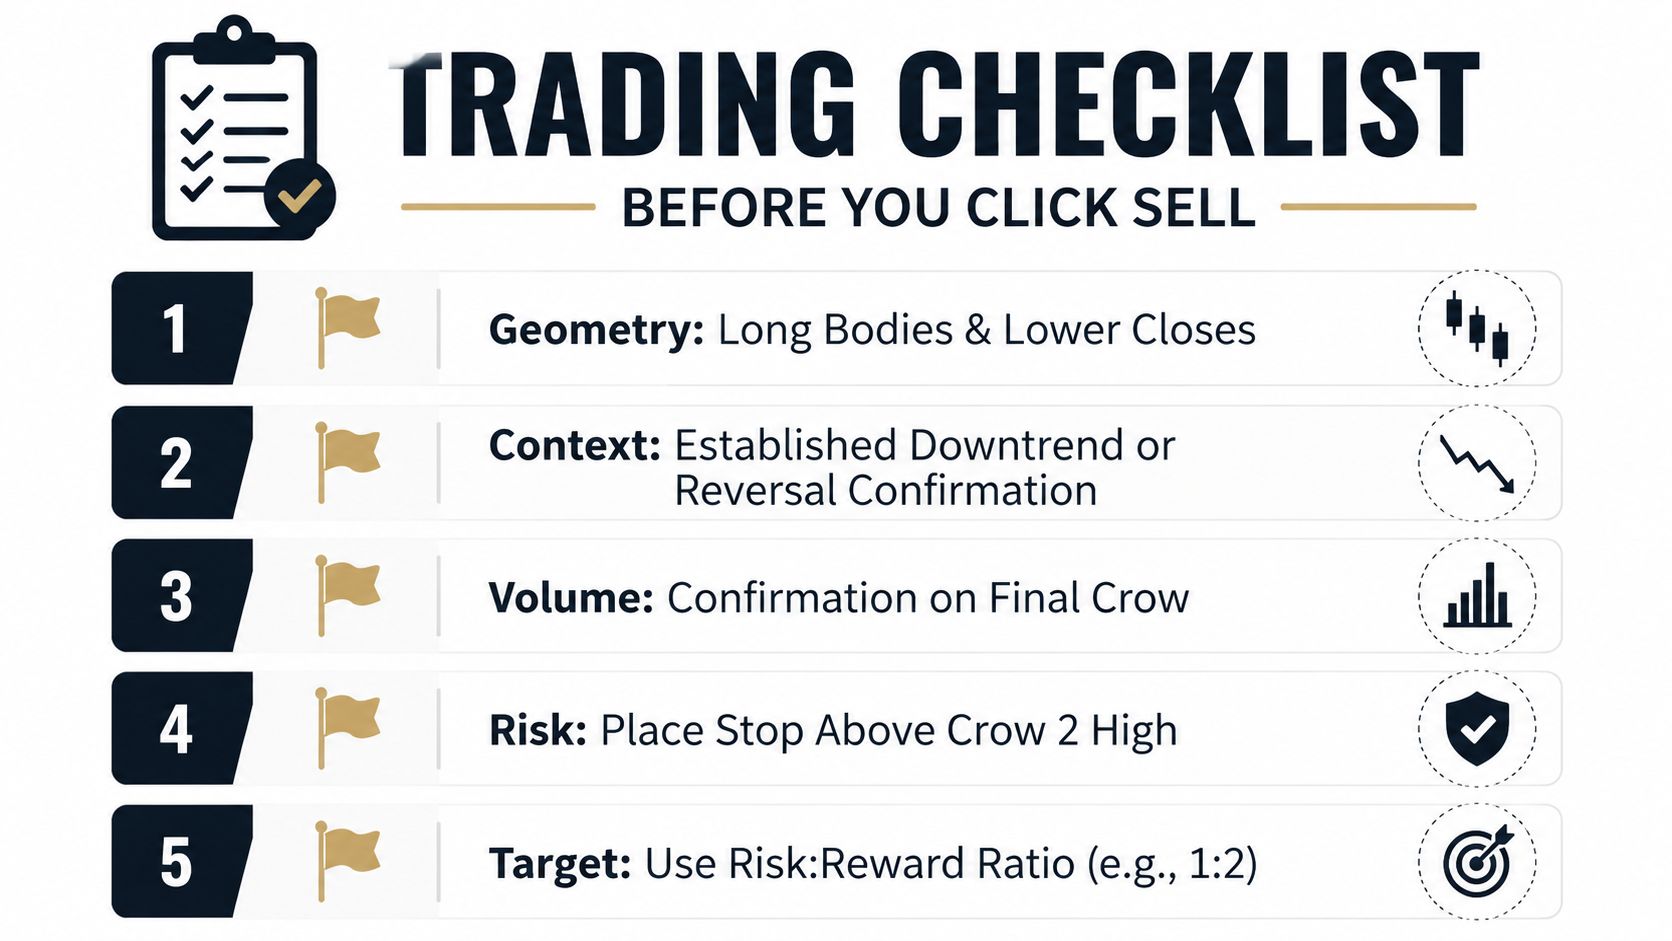
The fastest way to misuse this pattern is to skip context and short every three-candle decline. Don't do that. Use a pre-trade filter that checks geometry, location, confirmation, and risk before you commit to the trade.

A five-step trading checklist infographic for identifying and executing the three black crows candlestick pattern.

<a id="a-quick-pre-trade-screen"></a>

A quick pre-trade screen

  • Geometry: Three consecutive bearish candles, each with a long body, each opening inside the prior body, each closing lower and near the low.
  • Context: A clear prior uptrend, ideally near resistance or a round number, with RSI already overbought.
  • Confirmation: Volume should rise through the sequence or at least stay supportive, and the next candle should not erase the breakdown.
  • Risk: Place the stop above the pattern high or the prior swing high so the trade is defined before entry.
  • Target: Use a preplanned reward level, not a hope-based exit.

The two mistakes that hurt most traders are simple. They trade the pattern without the prior uptrend, and they ignore lower shadows that show buyers are still pushing back. If either of those shows up, the setup is usually not clean enough to press.

📌

If the chart needs you to squint, it's probably not a clean short.

<a id="frequently-asked-questions-about-three-black-crows"></a>

Frequently Asked Questions About Three Black Crows

<a id="how-tall-should-the-candles-be"></a>

How tall should the candles be

They should be tall relative to recent price action, not just red. Bulkowski's description says the candles should be taller than the average candle height over the prior week or two, which is a good way to keep yourself from labeling ordinary noise as a reversal pattern.

<a id="what-timeframe-works-best-in-crypto"></a>

What timeframe works best in crypto

The pattern tends to be easier to read on daily and four-hour charts than on very low timeframes, where false positives are more common. Lower timeframes can still work, but they demand more confirmation and usually more discipline around stops.

<a id="what-invalidates-the-setup"></a>

What invalidates the setup

Long lower shadows, shrinking bodies, a weak prior trend, or falling volume all weaken the signal. If the market never had a real uptrend, the pattern is usually just a bearish cluster, not a meaningful reversal.

<a id="can-i-combine-it-with-other-indicators"></a>

Can I combine it with other indicators

Yes, and you probably should. RSI, MACD, and volume profile can help confirm whether the move is stretched or whether sellers are pressing into real liquidity. The key is not to over-filter the setup until you remove every candidate, because then you're no longer testing a pattern, you're testing a fantasy.


If you want a cleaner way to screen, validate, and compare the Three Black Crows pattern against your own watchlist, open GeckoScreener and test the setup on the coins you already follow, then review the equity curve and trade log before you risk real capital.

Created with Outrank

G

GeckoScreener Team

Written for the GeckoScreener community. Join us on Telegram →

Start screening cryptocurrencies for free

Apply strategies like this one in real-time across 250+ coins.

Try GeckoScreener →