Backtest Crypto Trading Strategy: A No-Code Guide for 2026
Learn how to backtest crypto trading strategy with GeckoScreener's no-code builder. Define rules, run portfolio tests, and interpret equity curves.
GeckoScreener Team
Aug 17, 2026 · 15 min read
Updated about 2 months ago

You spot a clean RSI setup on Bitcoin. The first trade wins, the second follows, and the third makes the pattern feel proven. You commit real capital just before the market turns sideways, volatility changes, and the same signal starts producing losses. A few successful chart examples can create confidence, but they can't tell you whether the rules survive different coins, timeframes, fees, and market regimes.
To backtest a crypto trading strategy properly, you need more than a profitable-looking curve on one chart. You need explicit rules, unseen data, realistic execution assumptions, and results you can inspect trade by trade. GeckoScreener's no-code workflow is designed for translating plain-language ideas into runnable queries, testing them across a portfolio of assets, and reviewing the equity curve before trading and alerts become available on the platform.
Table of Contents
- Why Your Last Strategy Failed in Live Trading
- Defining Your Trading Rules Before You Touch Any Tool
- Translating Plain Language Into GeckoScreener Queries
- Choosing Timeframes and Coins That Match Your Strategy
- Running Portfolio and Per-Coin Backtests
- Common Backtesting Traps That Destroy Crypto Strategies
- Your Repeatable Backtesting Workflow
Why Your Last Strategy Failed in Live Trading
Most failed strategies aren't exposed by a dramatic coding error. They fail because the trader tested a convenient slice of history, often one coin during a strong trend, then assumed the result described the strategy itself. A setup that worked three times in a row may have captured a temporary market condition rather than a repeatable edge.
Backtesting applies fixed entry, exit, and risk rules to historical data so you can examine how those rules behaved before risking capital. That matters especially in crypto because markets trade continuously and can move sharply within minutes. A signal that appears reliable on one sampling interval can look weaker when the same rules are tested on another.
The practical question isn't, “Did this strategy make money once?” It's, “Under what conditions did it work, and what happened when those conditions disappeared?”
What a backtest can reveal
A disciplined test can help you identify:
- Rule quality: Whether your entry and exit conditions produce a coherent trade sample.
- Risk behavior: How losses cluster, how long drawdowns last, and whether one asset drives the result.
- Regime dependence: Whether the edge appears only during trending markets, high volatility, or a particular historical period.
- Execution sensitivity: How results change when you account for bar size, fees, slippage, and venue-specific conditions.
A 2026 crypto backtesting study found that the same rules produced materially different outcomes on 5-minute, 15-minute, and 30-minute bars, with the 15-minute setting delivering the strongest risk-adjusted performance in that test. The result doesn't make 15-minute trading universally superior. It shows that crypto backtests are sensitive to data frequency and execution assumptions, so one attractive setting can mislead you. Review the study on timeframe sensitivity.
Practical rule: Treat every backtest as a conditional answer. It describes what your rules did on specific data, at a specific frequency, under specific assumptions.
A backtest can't guarantee future returns, reproduce every live fill, or remove the psychological difficulty of following rules during a losing streak. It also can't repair vague logic. Before opening a tool, define exactly what qualifies as an entry, what closes the position, and how risk is controlled.
Defining Your Trading Rules Before You Touch Any Tool
A strategy isn't “buy weakness” or “sell when momentum fades.” Those phrases describe an idea, not a testable system. If two traders could read the same rule and choose different trades, the rule still contains judgment that your backtest can't measure consistently.
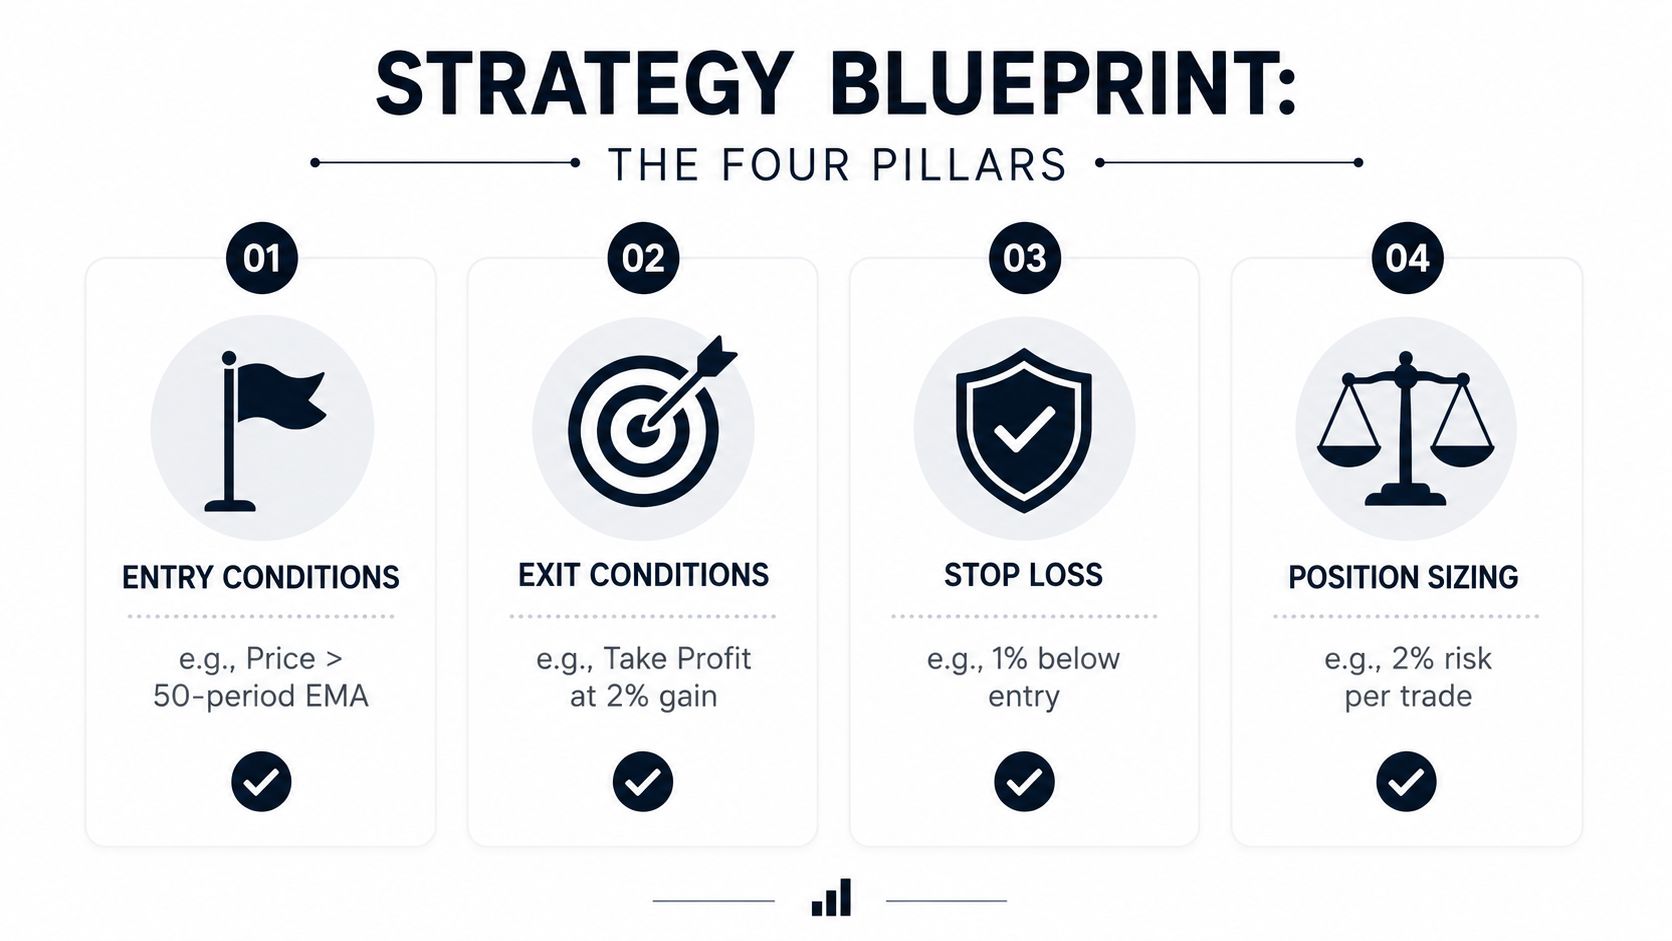
Write the strategy around four pillars:
- Entry conditions: What must happen before a position opens?
- Exit conditions: What event closes a winning or neutral position?
- Stop-loss parameters: At what price or condition do you accept a loss?
- Position sizing: How much capital or risk does each trade use?
Take a concrete example. The entry rule could be: buy on the daily chart when RSI falls below 30 and a bullish hammer candlestick forms. The exit rule could be: sell when RSI crosses above 70. The risk rule could close the position when price falls 5% from entry, while the profit target could be defined separately if the strategy uses one.
That wording is much more useful than “buy the dip.” It tells the builder which indicator, threshold, timeframe, pattern, and exit event to evaluate. You should also define what happens if both an exit signal and a stop-loss appear in the same bar, whether a position can be reopened immediately, and how the strategy handles trades that remain open without reaching a target.
Use a rule template
Write each idea in a consistent format before translating it:
| Rule component | Plain-language example |
|---|---|
| Market universe | Eligible crypto assets in the selected portfolio |
| Timeframe | Daily candles |
| Entry | RSI below 30 and a bullish hammer forms |
| Exit | RSI crosses above 70 |
| Stop-loss | Close at a 5% decline from entry |
| Take-profit | Use a defined target, or state that no fixed target applies |
| Position sizing | Specify a consistent allocation or risk rule |
| Trade handling | Define whether overlapping positions are allowed |
The template forces missing decisions into view. Position sizing belongs in the blueprint, even when the first test focuses only on signal quality, because a strategy with a promising entry can still be unusable if its exposure is undefined.
Don't change the rules halfway through a test because the last few trades looked disappointing. Save the original version, record the dates and assumptions, and create a separate version for any deliberate revision. That separation protects the result from becoming a mixture of incompatible rule sets.
Translating Plain Language Into GeckoScreener Queries
The most error-prone part of strategy testing is often the translation from an idea into exact conditions. A trader may understand what they want visually but struggle to express the logic in code, API syntax, or a spreadsheet. GeckoScreener provides a no-code strategy builder that converts a plain-language description into a runnable query.
Start with one complete sentence:
Buy when RSI is below 30 and a hammer candlestick forms on the daily chart. Sell when RSI crosses above 70 or price drops 5% from entry.
The builder should turn that sentence into separate conditions rather than treating it as a loose description. Confirm that the timeframe applies to both the RSI reading and the candlestick pattern, that “and” requires both entry signals, and that “or” allows either exit condition to close the trade.
Build from simple conditions
Begin with the smallest version of the strategy:
- Indicator: RSI below 30.
- Pattern: Hammer on the same daily candle.
- Exit: RSI crossing above 70.
- Protection: A 5% stop-loss from entry.
Run that version before adding more filters. If you immediately layer RSI, MACD, EMA direction, volume, and several pattern conditions, you won't know which rule creates the result or which one removes valid trades.
Once the base query behaves as expected, add a second indicator deliberately. For example, you might require MACD confirmation or specify that price must sit above a chosen EMA. The platform supports indicator filters such as RSI, MACD, ADX, EMA, volume, and price action, alongside 19 candlestick pattern detectors, including Doji, Hammer, and Morning Star.
For a broader framework for selecting and combining indicators, see this guide to crypto trading indicators.
Check the logic before running history
Natural language can hide ambiguity. Review these points in the generated query:
- Signal timing: Does the trade enter at the close of the signal candle or at the next available price?
- Crossing logic: Does “crosses above” require RSI to move from below 70 to above 70, or does any value above 70 qualify?
- Pattern confirmation: Is the candlestick pattern complete before the entry is evaluated?
- Exit priority: Which event is recorded if a stop and target are both touched within one candle?
- Repeated signals: Can the strategy open another position while one is already active?
A good builder reduces syntax errors, but it doesn't eliminate the need to inspect assumptions. Save the query only after you can explain every condition in ordinary language. That explanation becomes your reference when comparing later versions.
Choosing Timeframes and Coins That Match Your Strategy
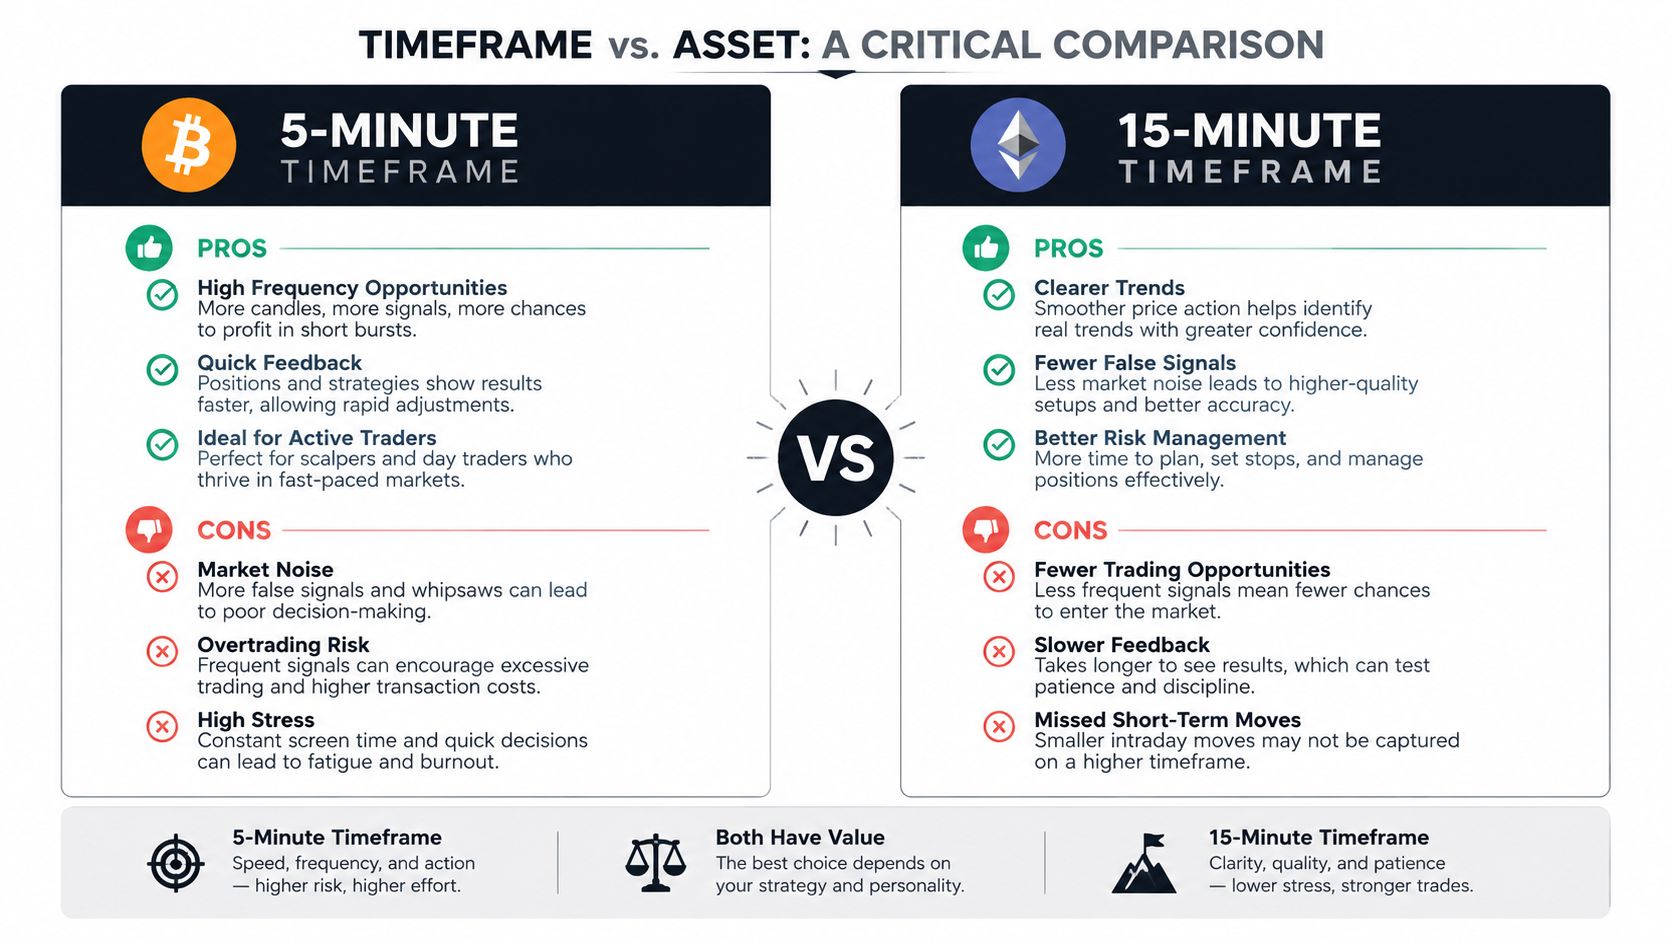
Timeframe selection changes the strategy you're testing, even when the written rules stay identical. A 5-minute system receives more intraday price fluctuations than a 15-minute system, while a daily strategy compresses many short-term moves into one candle. The resulting entries, stops, exits, trade duration, and exposure can all change.
The 2026 study cited earlier tested identical rules on 5-minute, 15-minute, and 30-minute bars and found the best risk-adjusted result on the 15-minute interval. That finding is useful as a warning, not as a universal setting. Test the timeframe that matches how you'll execute, then compare nearby granularities to see whether the apparent edge survives a reasonable change in sampling. Learn the chart-reading principles that support timeframe selection.
Match the test to the trading job
A scalper may care about rapid execution, spread, and order-book depth. A day trader may focus on intraday signal frequency and whether the equity curve depends on a narrow market session. A swing trader may use daily or higher-timeframe conditions and accept fewer signals in exchange for longer holding periods.
Don't choose a timeframe because it produces the prettiest curve. Choose it because you can monitor it, execute it, and tolerate its drawdowns in live conditions.
Coin selection deserves the same discipline. Bitcoin alone can make a strategy appear stable because it has deeper liquidity and a longer trading history than many altcoins. That result doesn't establish that the strategy works across the broader market.
Use a portfolio test across the top 100 coins first, then inspect individual assets. Portfolio mode helps answer whether the rules have broad behavior or depend on a narrow group. Per-coin results reveal whether one token, sector, or unusual price history is carrying the whole outcome.
After the broad test, you can run focused universes such as DeFi, Layer 1 assets, or meme coins. The point isn't to reject specialization. It's to label it accurately. A strategy designed for one sector should be tested as a sector strategy, not presented as a universal crypto edge.
Running Portfolio and Per-Coin Backtests
Once the query, timeframe, and asset universe are fixed, run the test without changing the rules to improve the curve. GeckoScreener supports backtesting over up to nine months of historical data across the top 100 coins, with both portfolio-level and per-coin evaluation.
Start with portfolio mode. This combines qualifying trades across the selected assets and gives you a broad view of how the strategy behaves when opportunities appear throughout the market. It can expose a useful property that a Bitcoin-only test hides, such as whether losses arrive simultaneously across many coins or whether the strategy finds opportunities outside the market leader.
Then switch to per-coin mode. The combined curve may look healthy while one asset contributes most of the gains. If the trade history shows that result, the portfolio isn't demonstrating broad stability. It's demonstrating dependence on a single coin or a small cluster of correlated assets.
Read the equity curve as a sequence
An equity curve isn't just a final return line. Read it from left to right:
- Consistency: Does growth occur across multiple periods, or in one brief burst?
- Drawdown shape: Are losses shallow and brief, or deep and prolonged?
- Recovery: Does the strategy recover through new signals, or require one unusually large winner?
- Concentration: Do major jumps correspond to a single coin, pattern, or market event?
A healthier curve usually shows uneven progress with ordinary pullbacks, rather than a perfectly smooth climb. A curve that rises sharply during one trend and then remains flat can indicate regime dependence. A curve that changes dramatically when one coin is removed deserves further investigation before deployment.
Inspect the trade log, not only the summary
Open the detailed history and sort trades by asset, date, direction, holding period, and outcome. Look for clusters of losses during sideways conditions, repeated entries after the same signal, and exits that appear unrealistic for the chosen timeframe.
Record the data source, date range, query version, fee assumptions, and execution assumptions. This practical backtesting guide also emphasizes logging exit rules, adding fees and slippage, and preserving the assumptions so another person can reproduce the test.
A portfolio result is a starting point for investigation, not a permission slip to trade. The per-coin breakdown tells you what the aggregate number is made of.
Common Backtesting Traps That Destroy Crypto Strategies
A backtest can be mechanically correct and still economically misleading. Crypto adds venue fragmentation, continuous trading, perpetual-futures funding, exchange outages, flash crashes, delistings, symbol changes, and thin order books. If the test ignores those conditions, its directional conclusion may be reasonable while its expected live performance is not.
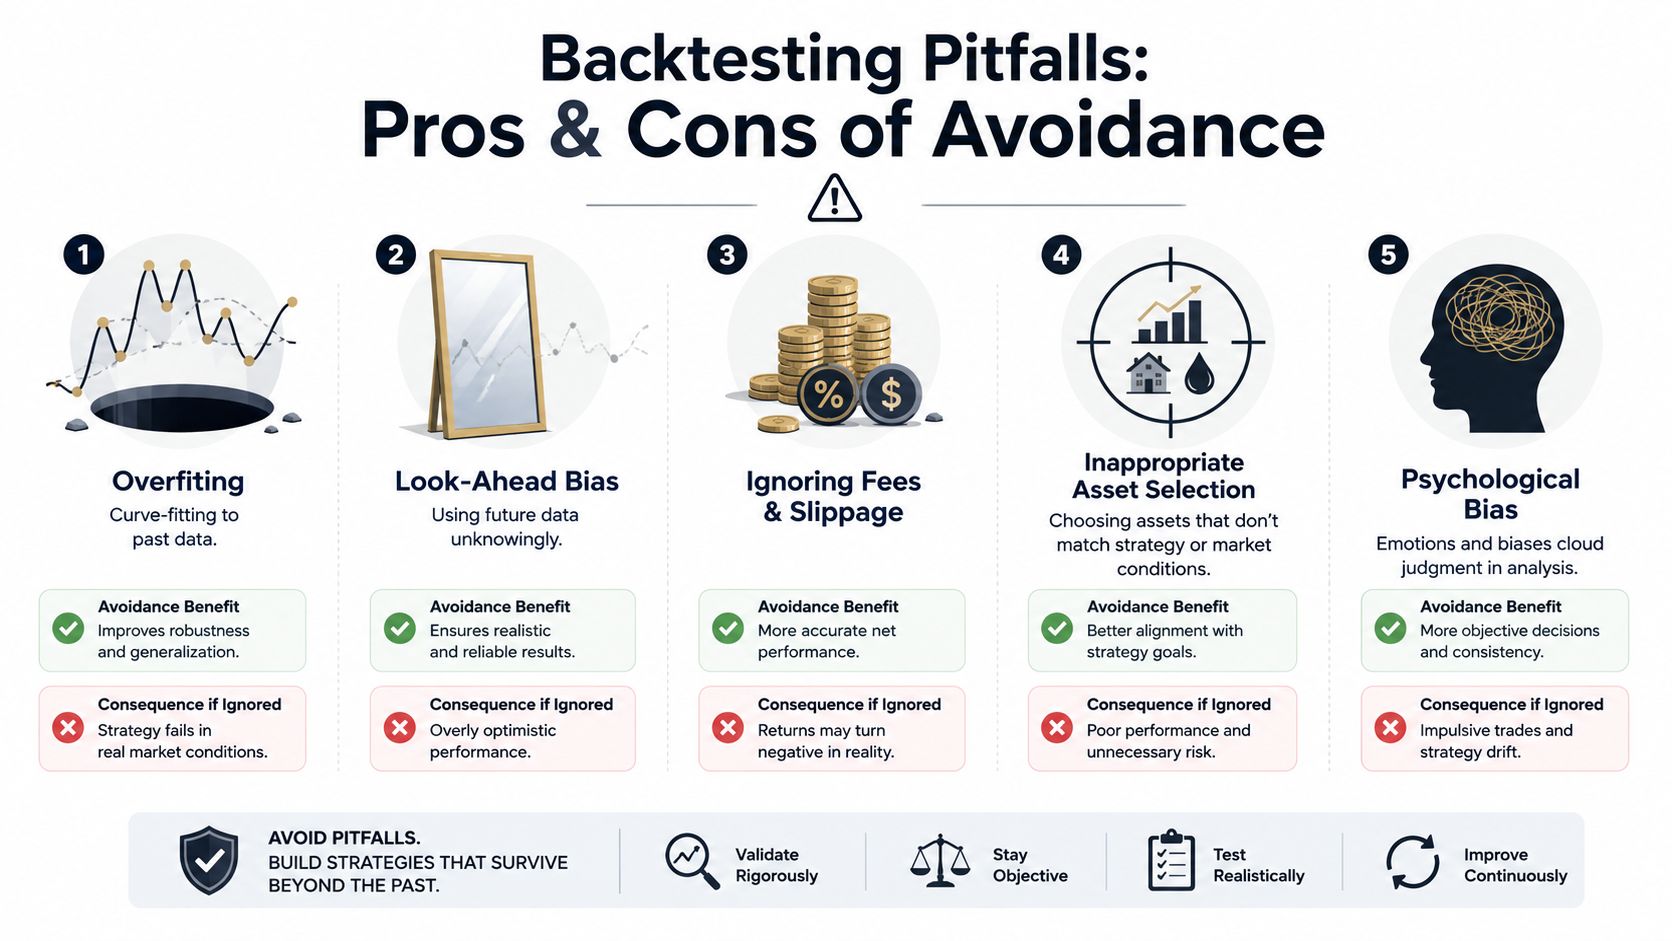
Five checks belong in every review
- Overfitting: If you keep adjusting thresholds until the historical curve looks perfect, you may be fitting noise. A 2022 deep-reinforcement-learning study tested 10 cryptocurrencies from 05/01/2022 to 06/27/2022, including two major crypto-market crashes, and found that less-overfitted agents outperformed more-overfitted agents, an equal-weight strategy, and the S&P DBM Index benchmark. Read the study on overfitting and out-of-sample evaluation.
- Survivorship bias: Testing only coins that still trade removes failed or delisted assets from the sample. Include historical constituents where the data permits, or state clearly that your universe contains surviving assets only.
- Fees and slippage: A crypto backtest should model continuous market data, exchange-specific costs, and execution friction. One guide recommends fees in the range of 0.1% to 0.5% per trade and accounting for perpetual-futures funding rates. Review these crypto-specific cost assumptions.
- Small samples: Fewer than 30 trades is statistically weak for judging a strategy. Test through quiet periods, volatility shocks, and at least one failure period instead of relying on a single bull run. See the discussion of sample size and regime coverage.
- One market regime: A trend strategy may look excellent in a persistent advance and fail in a range. Compare behavior across different conditions rather than treating one favorable period as proof.
A separate crypto-focused analysis reported that 73% of strategies degraded meaningfully on unseen data, while only 34% of backtested Sharpe ratio was retained out of sample on average and 41% of strategies with positive backtests turned negative out of sample. It also reported that strategies with more than 5 optimizable parameters were 2.8 times more likely to be overfit. Examine the analysis of out-of-sample deterioration.
The cleanest defense is a rolling in-sample and out-of-sample process. Optimize only on the in-sample window, freeze the settings, test unseen data, roll forward, and repeat across regimes. A practical starting point is a 3:1 train-test split, using 3 to 6 month training windows, 1 to 2 month test windows, and at least 5 walk-forward cycles. Review the walk-forward validation workflow.
Your Repeatable Backtesting Workflow
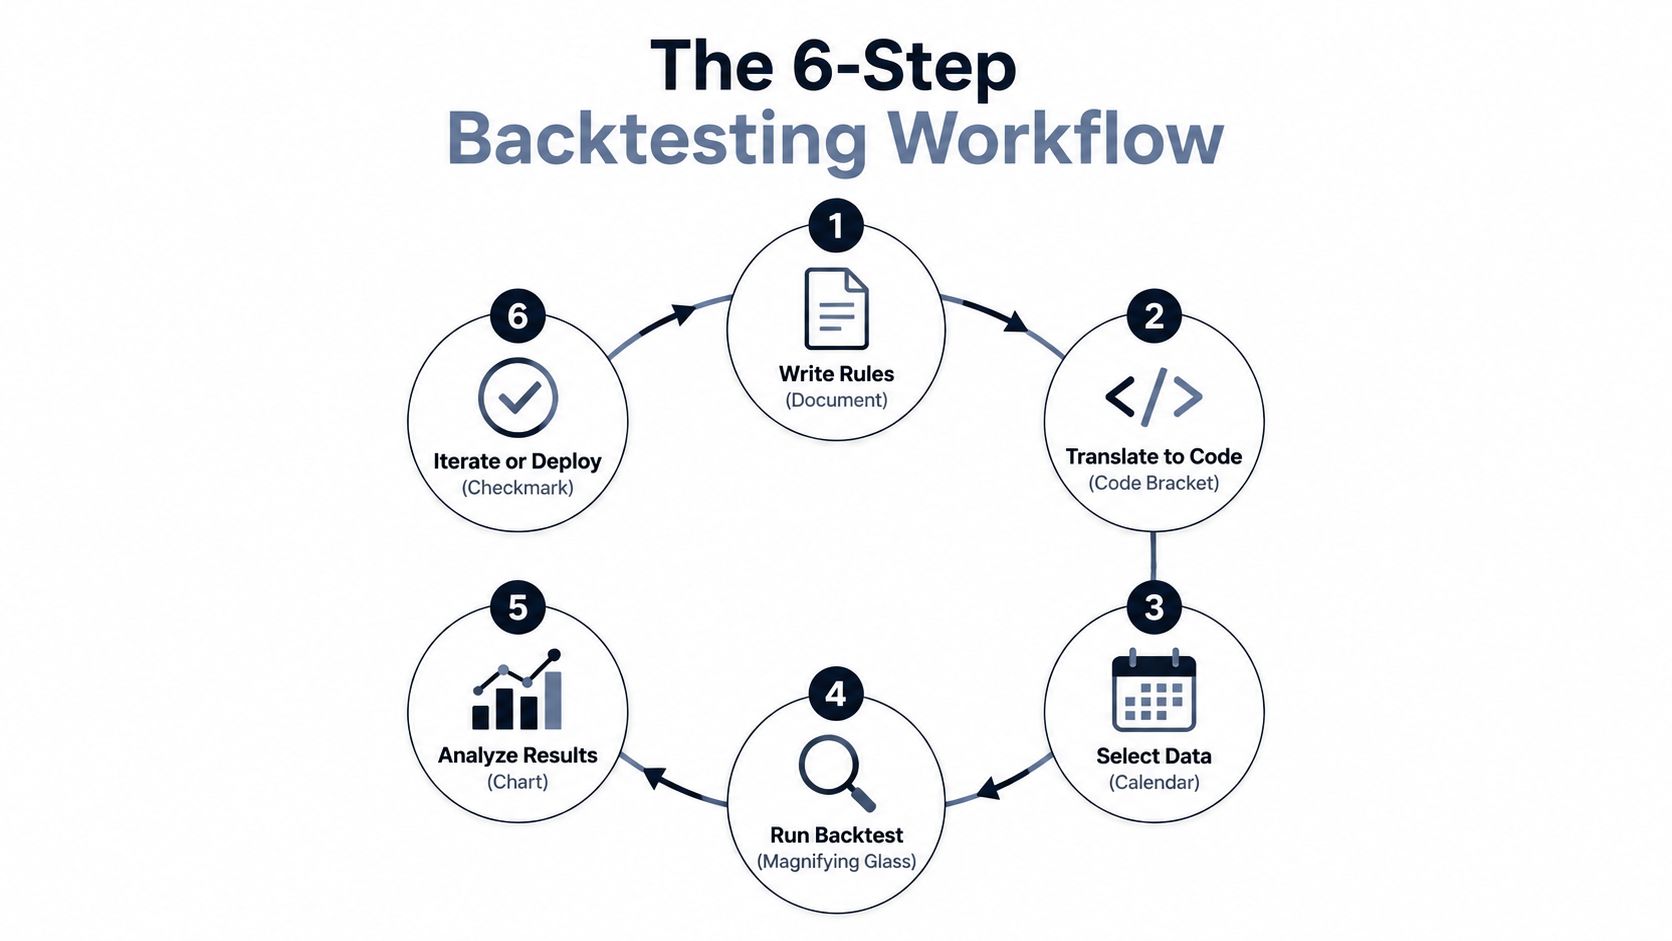
Use the same sequence every time you backtest a crypto trading strategy:
- Write the rules: Define entries, exits, stops, targets, position sizing, and handling for open trades.
- Translate the idea: Use GeckoScreener's no-code builder to turn plain language into explicit conditions.
- Select the data: Match the timeframe and coin universe to the strategy, then test more than one granularity.
- Run both modes: Compare portfolio results with per-coin behavior across the available historical window.
- Analyze the output: Review the equity curve, drawdown shape, trade clusters, and complete trade history. A dashboard with trade-by-trade analysis is more useful than a single return figure because it lets you inspect win rate, profit factor, and risk behavior. See an example of a detailed backtest dashboard.
- Validate before deployment: Add fees, slippage, funding where relevant, and out-of-sample testing. Save the query, dates, data source, and assumptions.
Save each strategy version and share the results with the GeckoScreener community when you want outside review. The platform doesn't currently offer trading or backtesting features, but backtesting and alerts will be live very soon, so documenting your rules now will make it easier to evaluate them consistently as those capabilities arrive. For broader research workflows, explore crypto market analysis tools.
GeckoScreener brings crypto screening, plain-language strategy design, portfolio testing, equity curves, and detailed trade histories into one workflow, so you can challenge an idea before committing capital. Visit GeckoScreener, write down your next setup, and prepare it for the upcoming backtesting and alerts features instead of relying on a few lucky live trades.
GeckoScreener Team
Written for the GeckoScreener community. Join us on Telegram →
Related Articles


Start screening cryptocurrencies for free
Apply strategies like this one in real-time across 250+ coins.
Try GeckoScreener →