10 Best Crypto Market Analysis Tools for 2026
Discover the top 10 crypto market analysis tools for 2026. Compare platforms for charting, screening, backtesting, and on-chain data to elevate your trading.
GeckoScreener Team
Aug 1, 2026 · 20 min read
Updated about 2 months ago
Most crypto market analysis tools solve one third of your problem. You're probably staring at three tabs right now, one with a chart, one with a screener, one with on-chain data, trying to work out which signal matters and which is noise. There are more tools than ever in 2026, they're richer than ever, and they still don't fit together on their own.
In short: No single platform covers screening, charting and on-chain context well. The traders who stay sharp run three layers: one tool to find the setup, one to read the chart, one to check whether real money is behind the move. The ten below are grouped by which of those jobs they actually do.
Picking tools by job rather than by brand hype is the whole trick. A fast-moving market rewards traders who can confirm a setup from more than one angle, and the best stacks now blend charting, on-chain context, derivatives, and backtesting. Glassnode alone lets you query 800+ metrics across 1,700+ assets with historical depth and point-in-time data, while CoinDesk Data calculates metrics like volume, open interest, and social stats in real time across its datasets. The research layer has got very wide, very fast.
The sections below are organized by use case, so you can match each platform to the part of the trade where it earns its keep.
Table of Contents
- All-In-One Screening, Strategy and Backtesting
- Advanced Charting and Technical Analysis
- On-Chain and Fundamental Data
- The 10 Crypto Market Analysis Tools Compared
- Integrating Your Toolkit for a Winning Strategy
All-In-One Screening, Strategy and Backtesting
The most practical tool category for active traders is the one that compresses the whole workflow into one place. Screening tells you what's moving, strategy logic tells you why you care, and backtesting tells you whether the idea has any historical edge. If those three steps live in different products, you spend too much time copying conditions around and too little time judging the setup.
Crypto market analysis tools used to mean separate terminals, separate data feeds, and separate charting tabs. That changed because the market itself is broader and more data-rich now, and because traders increasingly want to move from idea to test without rebuilding the same rule set three times. A workflow that lets you filter by price action, run indicator logic, and inspect trade history in the same environment saves time and cuts down on configuration drift.
Practical rule: If you can't express your setup clearly enough to test it, you probably don't understand the setup well enough to trade it live.
This category is strongest for swing traders, day traders, and systematic discretionary traders who want repeatable rules. It's weaker when you need deep entity intelligence or institutional-grade research coverage, but for rapid setup discovery, it's the cleanest starting point. For traders who want to go deeper into strategy design, the most useful companion resource is this backtesting guide for crypto strategies, because the quality of your test matters as much as the setup itself.
1. GeckoScreener
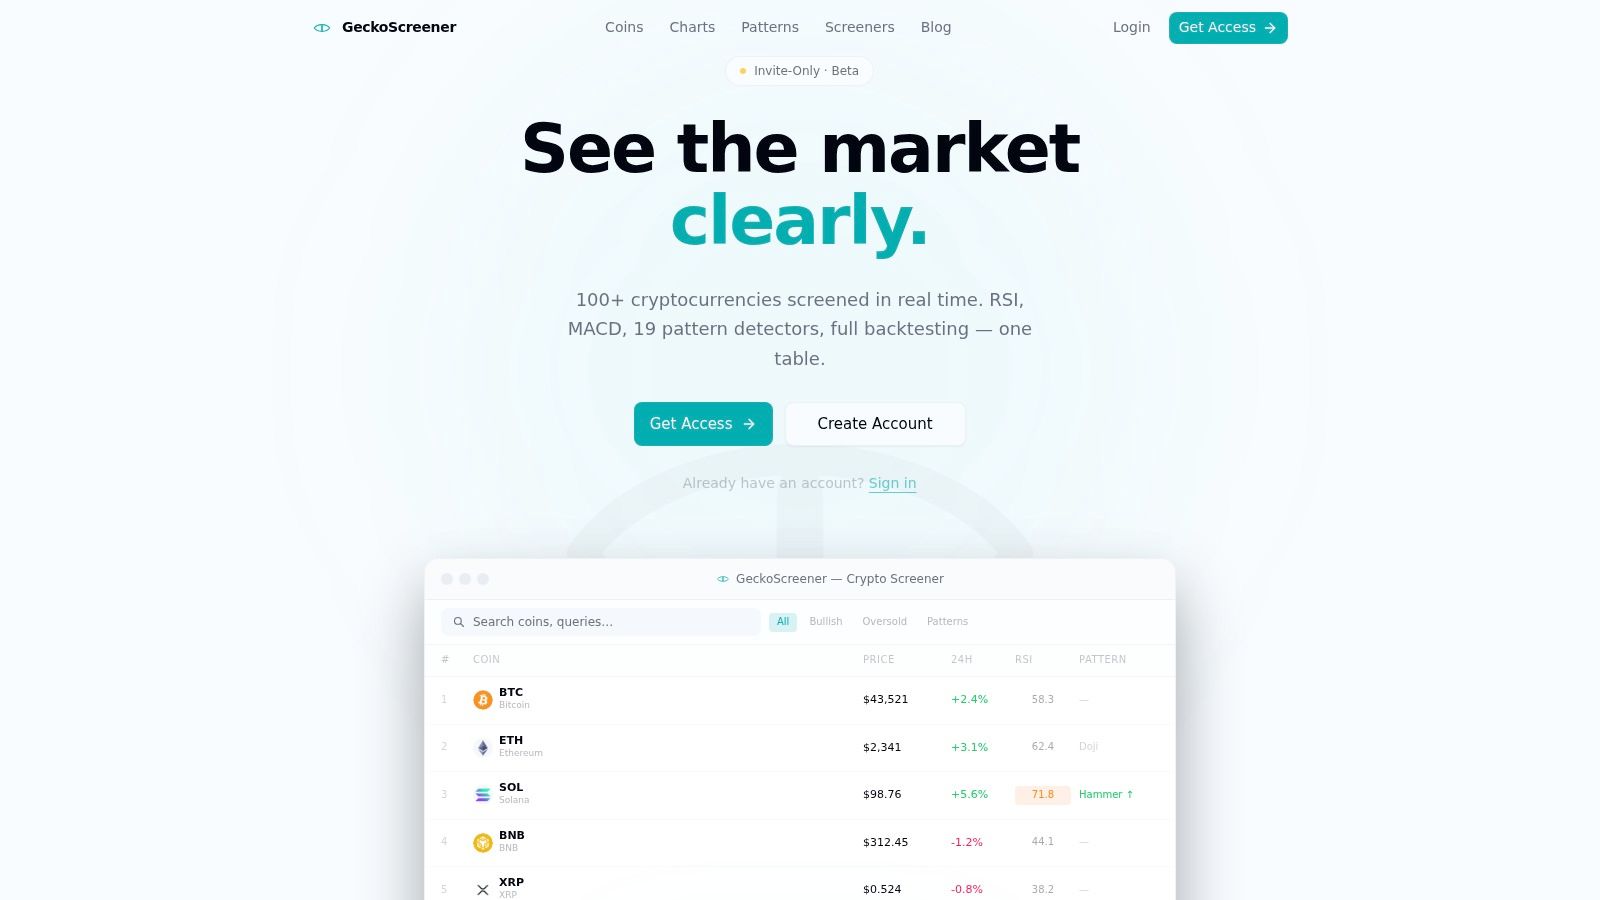
GeckoScreener screens 100+ cryptocurrencies in real time and puts RSI, MACD, 19 pattern detectors and full backtesting into a single table. The point is the loop rather than any one feature: you describe a setup in plain language, it becomes a runnable query, and you can test it against history before it reaches an order ticket.
That matters because the step most traders skip is validation. Writing a rule down forces you to say what you actually mean by "oversold near support", and running it over past data tells you whether the idea ever worked. Keeping screening, pattern detection and backtesting in one place removes the copying-between-tools tax that makes people skip the test.
Best fit
- Idea-to-test workflow: screen, formalize, backtest, without changing tabs.
- Pattern traders: 19 detectors run across the whole list, not one chart at a time.
- Rule-driven swing trading: repeatable filters beat re-reading charts from scratch.
Advanced Charting and Technical Analysis
A chart can tell you a lot in seconds, if the platform gives you the right tools. Traders use these platforms to check trend structure, compare timeframes, layer indicators, and decide whether a move is worth trading before they place an order. Investopedia's crypto charting guide frames technical analysis as the use of historical price data and price or volume-derived tools to forecast likely direction, with support and resistance, MACD, RSI, and Bollinger Bands among the core mechanics.
These platforms sharpen execution decisions. A trader can confirm trend continuation, spot a failed breakout, or compare momentum across several chart horizons before risking capital. For traders who are still choosing indicators, a guide to the best indicators for crypto trading is a useful companion, because the chart is only as good as the signals you decide to read from it.
The weakness is obvious. Charting alone doesn't tell you whether a move is supported by exchange flows, wallet behavior, or on-chain participation. Treat it as the visual front end for trade planning, not the full research process. More chart features can help with analysis, but they can also slow decision-making if every chart becomes a cluttered screen of indicators.
2. TradingView
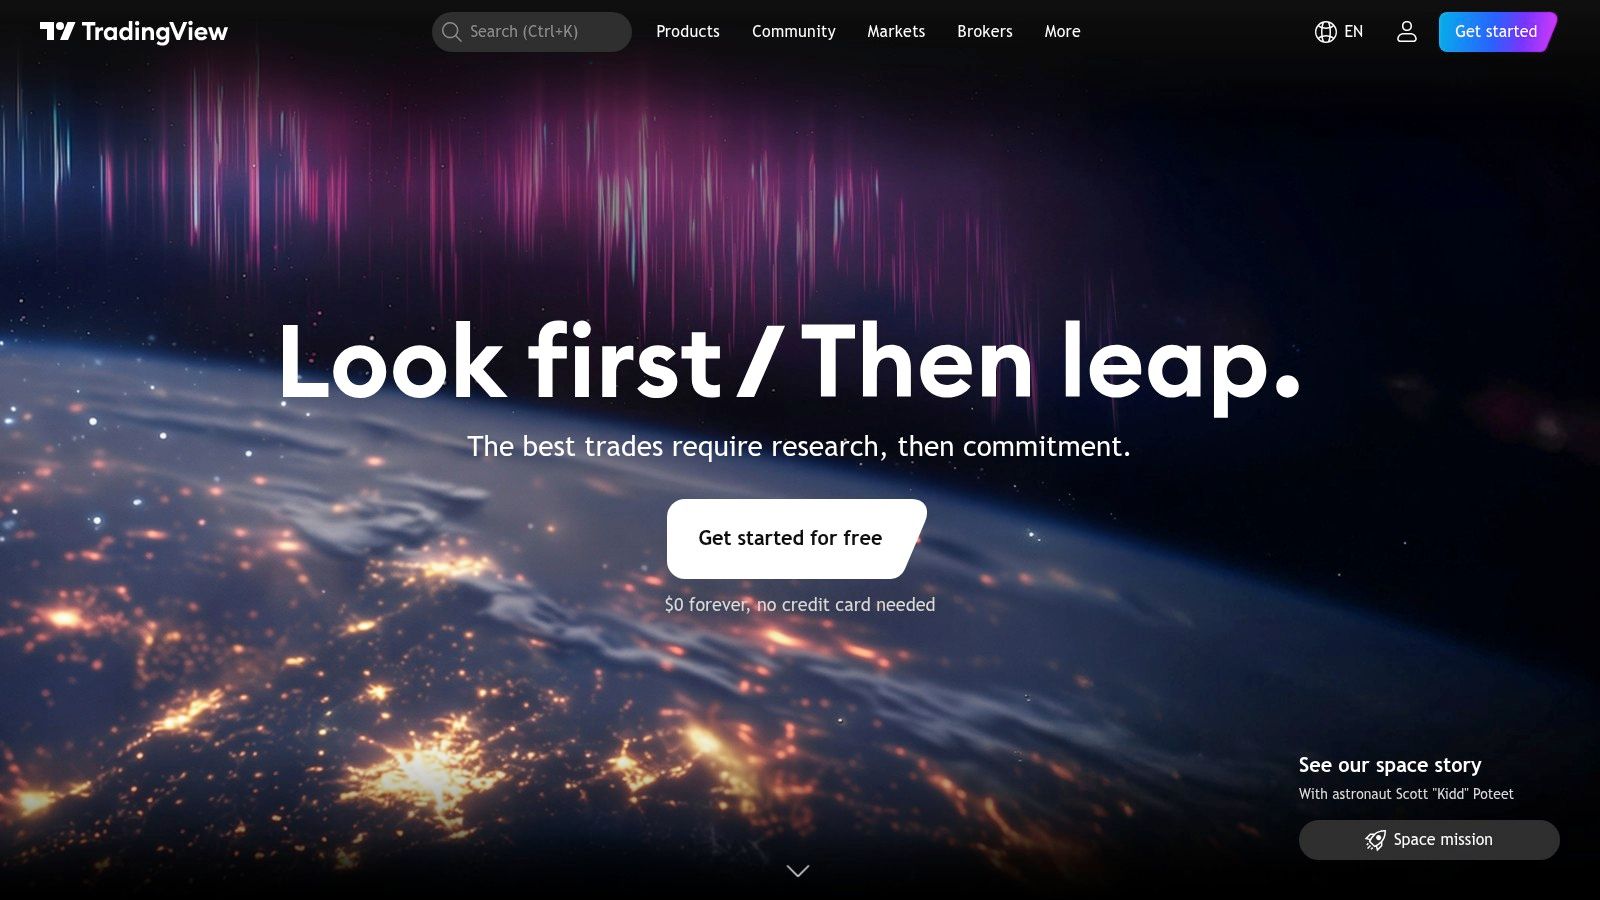
TradingView is the charting workspace most crypto traders already know, and for good reason. Industry coverage has described it as serving 50 million+ monthly active users, with 400+ built-in technical indicators, 100,000+ community-created indicators, and real-time coverage of 12,000+ cryptocurrency pairs, which helps explain why it sits at the center of so many discretionary workflows. It's where traders check structure, overlay scripts, and set alerts that don't require them to babysit every chart.
It works best as the primary charting layer for spot and derivatives traders who need breadth and speed. The script ecosystem is a major advantage, because community indicators and Pine Script make it easy to test a trading idea visually before committing real capital. That makes it strong for intraday traders who want alerts and layout flexibility, and for analysts who need to move between several assets quickly.
Its biggest limitation is access. The full feature set, especially multiple charts and a high alert count, sits behind paid plans. Casual users can get started, but heavy workflows tend to push into higher tiers once they need more screen real estate and alert depth.
Best fit
- Discretionary TA: clean charting, familiar overlays, and fast visual analysis.
- Alert-driven trading: server-side alerts reduce missed setups.
- Script experimentation: Pine Script gives traders a practical sandbox.
- Broad market scanning: the pair coverage makes relative strength work easier.
3. TrendSpider
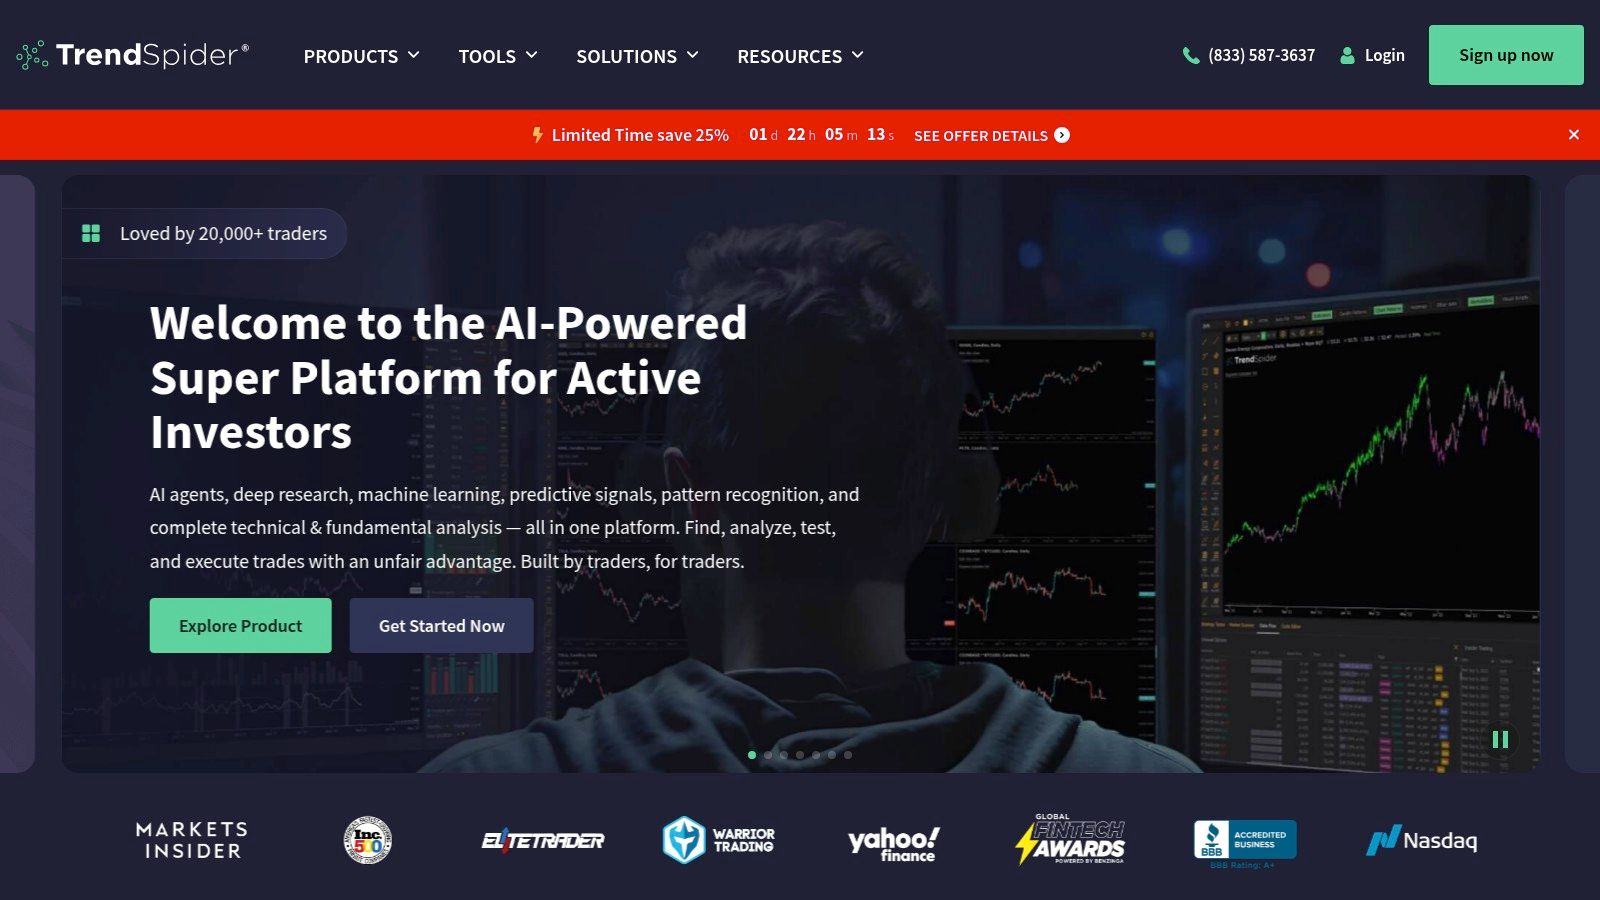
TrendSpider is the platform for traders who want less manual drawing and more rule-based detection. It automates trendlines and pattern recognition, runs multi-timeframe scanners, and supports no-code strategy testing with visual trade-by-trade review. That makes it appealing if you hate redrawing levels by hand, or if you want your scanner to do more of the first-pass work.
The main benefit is consistency. When the scanner and the charting logic use the same rules, you spend less time debating whether a level was subjective and more time deciding whether the setup is tradable. That's useful for swing traders who manage a rotating watchlist and want to remove some of the subjectivity from pattern work.
The trade-off is that it can feel like too much platform for a casual trader. If you only check charts occasionally, you may not use enough of the automation to justify the overhead. But if your process depends on scanning across several timeframes and reviewing patterns systematically, it's a strong fit.
Practical rule: Automation is worth paying for when it reduces repeated judgment, not when it just reproduces what you already do quickly by hand.
Pros
- Automated trendlines and patterns reduce chart clutter.
- No-code testing helps traders move from idea to validation quickly.
- Multi-timeframe scanners support more disciplined screening.
- Integrated review keeps the test and chart in one flow.
Cons
- Best value is in paid tiers.
- Casual users may not need the full stack.
On-Chain and Fundamental Data
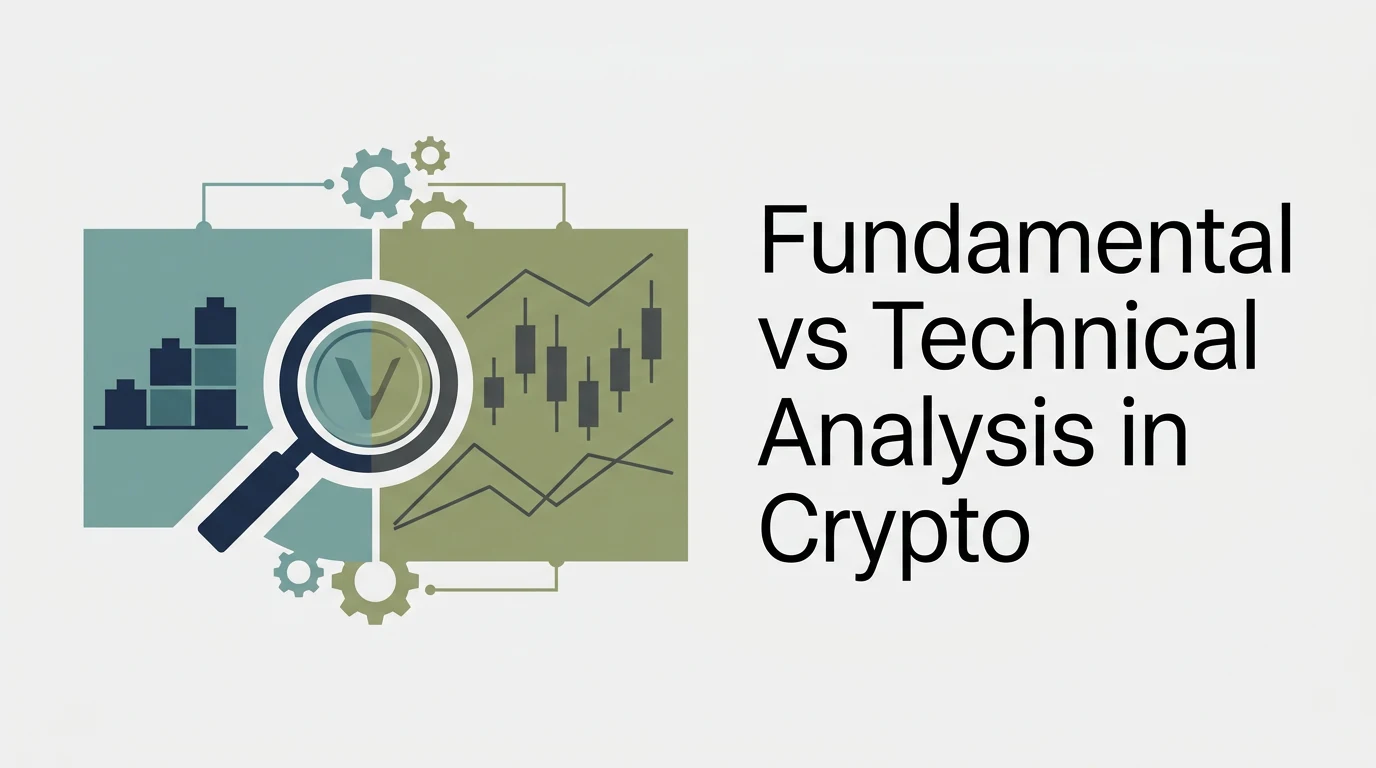
This category exists for traders who know that price alone rarely tells the whole story. On-chain and fundamental platforms help you check whether a move is supported by network activity, wallet behavior, developer activity, exchange flows, or broader ecosystem health. If the split between the two approaches is new to you, fundamental versus technical analysis in crypto covers how they fit together. That matters most when a chart looks strong but the underlying participation is weak.
A solid on-chain tool answers different questions than a charting platform does. Is a breakout backed by real usage, or is speculation doing all the work? Are wallets accumulating, or are exchange reserves shifting in a way that suggests supply pressure? Which assets are showing network-state confirmation before the move shows up in price?
This is also where the workflow gap shows up. Many products are good at data display, but fewer help you move from signal to rule to backtest in one place. For analysts who need a reusable process, the most valuable platforms are the ones that pair clean datasets with readable methodology and export options.
4. Messari
Messari sits on the research end of this category rather than the live-monitoring end. It combines asset profiles, curated research, sector datasets and APIs, so it's the tool you reach for when you need to understand a protocol or a sector properly, not when you need to know what happened in the last ten minutes.
That makes it a poor fit for intraday decisions and a good one for position-sizing decisions. If you're deciding whether a token deserves a place in a portfolio for the next two quarters, structured fundamentals and sector comparisons matter more than exchange flows. The pricing is oriented toward teams and institutions, which is the honest reason most individual traders end up using it occasionally rather than daily.
Pros
- Deep fundamental datasets with consistent asset profiles.
- Curated research saves time on protocol due diligence.
- Enterprise APIs for teams building internal reports.
Cons
- Enterprise-oriented pricing is steep for individuals.
- Built for research, not live trading decisions.
5. Santiment Sanbase
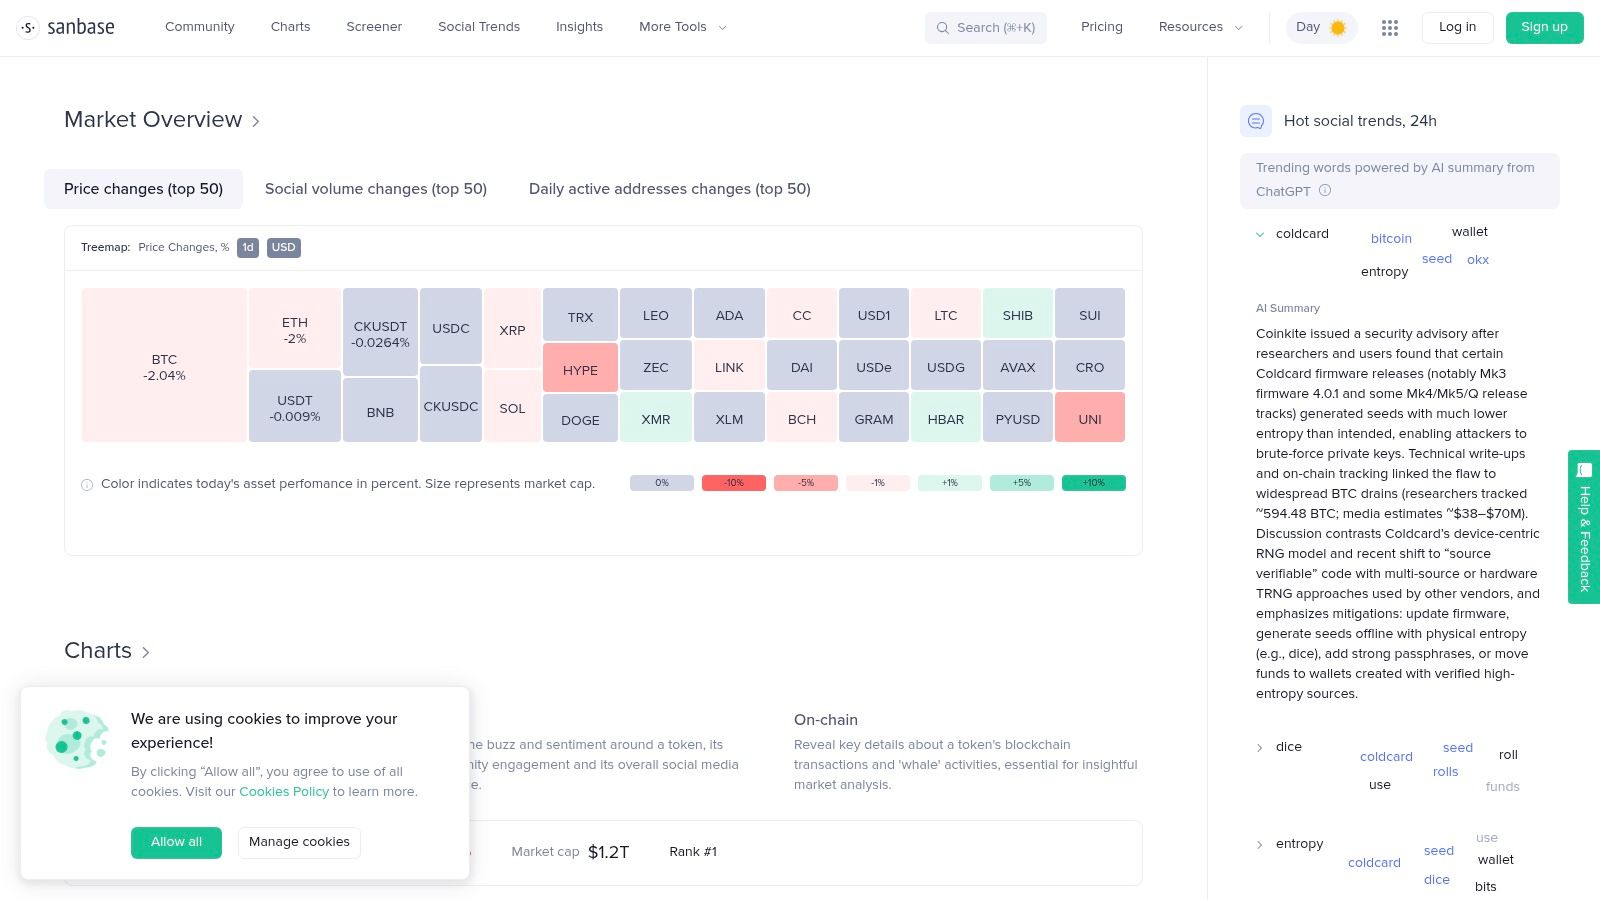
Santiment's Sanbase fits traders who want social trends, on-chain behavior, and development activity in one place. That matters most when a narrative starts building before price makes it obvious. It gives you a way to check whether attention is turning into real participation, or just noise.
The practical value is in timing and context. A social spike can front-run momentum, development activity helps show whether a project is still being built, and on-chain flows reveal whether capital is moving. That mix is most useful around majors and narrative-driven altcoins, where sentiment shifts fast and the chart alone doesn't explain why the move started.
The free tier is limited, with a 30-day data lag, so it becomes genuinely useful once you move into paid access. Even so, Sanbase has a clear role in a trading stack if your goal is to understand why attention is shifting, not just whether price is moving. Alerts, screening, and API access make it more than a dashboard, so it can sit inside a daily monitoring routine.
If a token is getting louder on social feeds while the underlying activity stays flat, that mismatch often matters more than the headline move. That gap can show up before traders fully price it in, and it's one of the cleaner ways to separate real participation from short-lived excitement.
Pros
- On-chain, social, and dev data in one UI.
- Alerts and screeners support active monitoring.
- Flexible payment options make access more adaptable for some users.
Cons
- The free plan has a 30-day data lag and limited features.
- Full value sits behind paid tiers.
6. Glassnode Studio
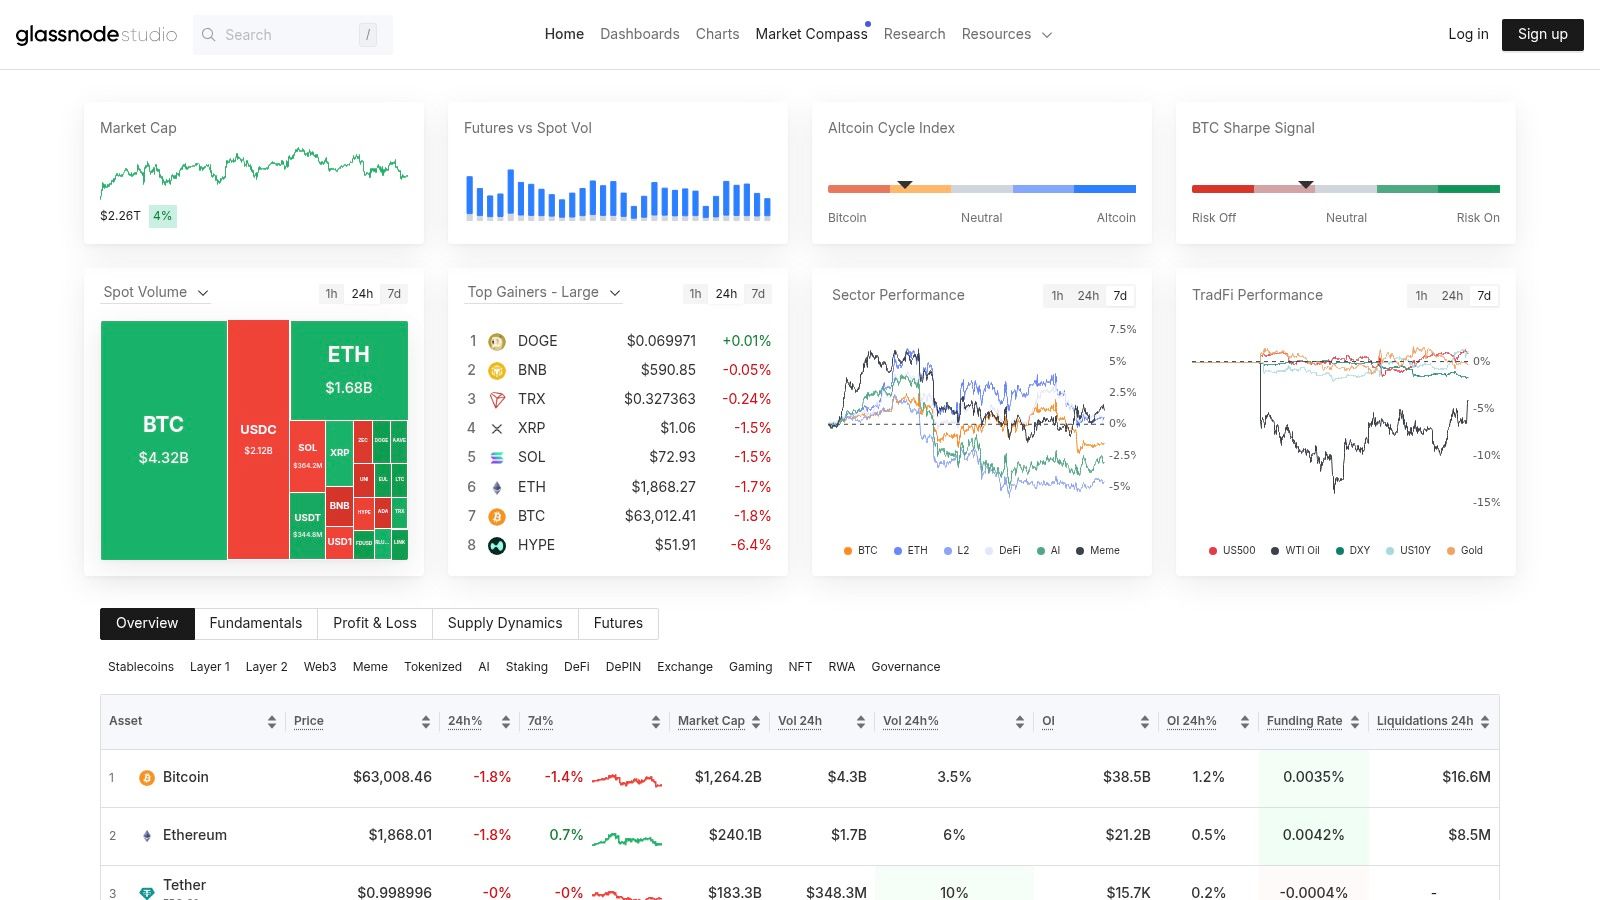
Glassnode Studio is the on-chain tool traders reach for in a live market when they need cycle context, liquidity regime analysis, and methodology-heavy data. It gives access to supply dynamics, realized cap, and cohort behavior, which makes it useful for analysts who care about structure instead of headlines alone. It earns its place when current price action needs to be compared with earlier market regimes.
Glassnode's framework combines spot, derivatives, traditional finance, macro, and on-chain indicators with activity, growth, adoption, and health metrics. That includes transaction activity, new-address creation, active addresses, hash rate, and staking or validator activity. The practical value is in confluence. A breakout backed by network-state confirmation carries more weight than a breakout with no visible participation behind it.
The platform fits traders and analysts who work across spreadsheets, APIs, and charts. Its integration options make it easier to reuse data inside a research workflow, and the point-in-time approach preserves historical context for review. That matters for backtesting ideas, checking regime shifts, and comparing a current move with a prior setup without losing the original market conditions.
Pros
- Institutional-grade on-chain coverage with clear methodology.
- Spreadsheet and API integration for deeper workflows.
- Strong for cycle and regime work.
Cons
- Upper tiers can be expensive.
- Access depth depends on plan.
7. CryptoQuant

A trader watching funding rates, exchange balances, and miner flows does not need more noise. CryptoQuant is useful because it turns those pressure points into a working read on liquidity, positioning, and supply behavior. That makes it a practical monitoring tool for spotting conditions that often show up before a sharp move.
It fits beside your charting platform, not in place of it. The candles show the setup, while CryptoQuant shows what may be happening under the surface, such as open interest building, funding getting stretched, or exchange reserves shifting in ways that affect liquidity. That context matters most in fast markets, where derivatives positioning can override an otherwise clean technical pattern.
Treat it as a monitoring layer. If exchange inflows rise, reserves move, or derivatives positioning starts to crowd one side of the trade, it helps you decide whether the chart is confirming strength or hiding fragility. Its alerting suits that workflow, and deeper history or API access matters if you want to keep the same process running across research and live trading.
Pros
- Strong exchange-flow coverage for liquidity and reserve checks.
- Useful derivatives context for active trading decisions.
- Alerts and dashboards make ongoing monitoring easier.
Cons
- Deeper history and API access sit behind higher tiers.
- Some features are paywalled.
8. Coin Metrics
Coin Metrics fits traders and analysts who care about clean inputs more than flashy dashboards. It covers network and market data across many chains and exchanges, plus reference rates, indices, and a free Community API for non-commercial use. That mix makes it useful for repeatable research, prototype work, and any workflow where you need the same dataset every time you rerun the analysis.
It's the one to reach for when you need a dataset you can trust without spending time reconciling messy definitions. Clear methodology saves time, reduces second-guessing, and makes it easier to compare assets with the same rules applied across the board. If a team is building scripts, models, or internal reports, Coin Metrics gives them a cleaner starting point than tools that prioritize convenience over consistency.
It belongs in the research and infrastructure part of the stack, more useful for back-end analysis, model prototyping, and data pipelines than for a quick market read before a trade. Traders who only need a visual snapshot may find it heavier than necessary, but analysts who review methodology later often value that discipline. You get transparent documentation and consistent schemas, but the free tier stays limited and broader coverage sits behind paid access.
Pros
- Transparent methodology documentation.
- Free Community API for entry-level prototyping.
- Consistent data schemas for technical workflows.
Cons
- Community limits are modest.
- Expanded coverage requires paid access.
9. Nansen
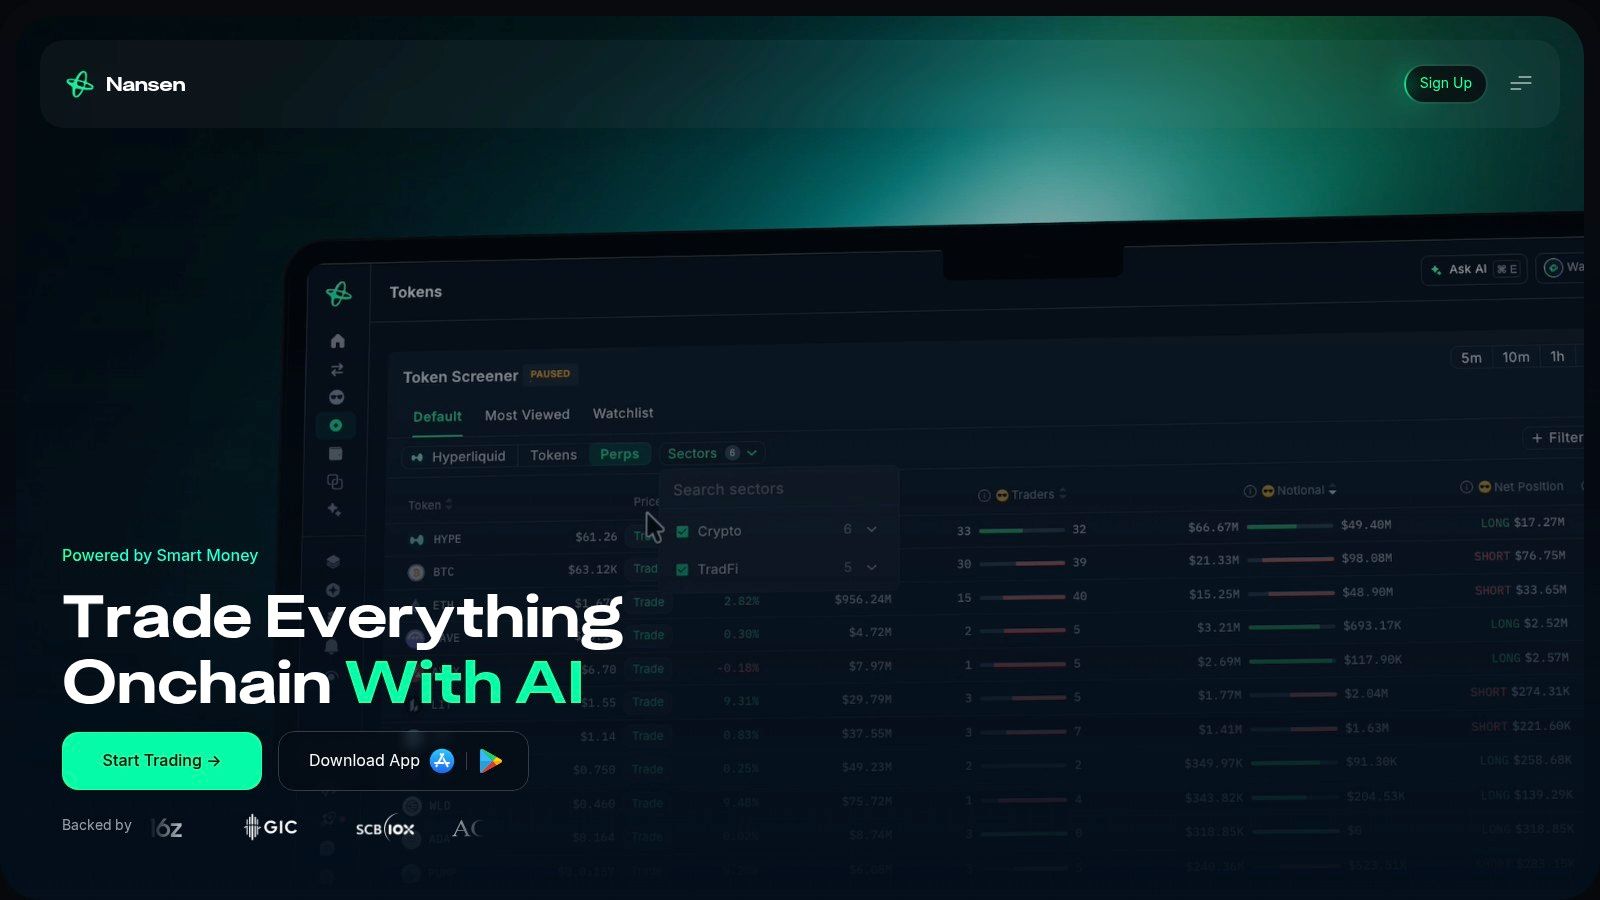
Nansen is the wallet-intelligence tool to reach for when you want to see smart-money behavior instead of just staring at price action. It labels wallets, tracks entity-level flows, and links token and NFT dashboards to address intelligence. That makes it especially useful when a narrative shift is being driven by capital moving through specific clusters rather than by broad market sentiment.
The practical value shows up in workflow. If you're trying to see where capital is flowing, who is accumulating, or which wallets are active around a token, Nansen gives a sharper read than generic market data. In fast-moving sectors, that kind of entity-level context can matter more than public chatter.
For short-term trading it works best as a confirmation tool. If wallet activity, holder behavior, and token flows point in the same direction, the setup deserves more attention. If those signals conflict, slow down and check whether the move is being driven by a few addresses, a temporary spike, or a broader shift in positioning. Its API model also matters for builders: Nansen Agents uses metered, pay-per-call access, which suits teams that want flexible consumption instead of fixed, monolithic access.
Pros
- Wallet labels and entity intelligence help track flows.
- Useful for smart-money and narrative analysis.
- Flexible API consumption for builders.
Cons
- Full functionality is paid.
- Public pricing and mechanics can change.
10. Sentora, formerly IntoTheBlock
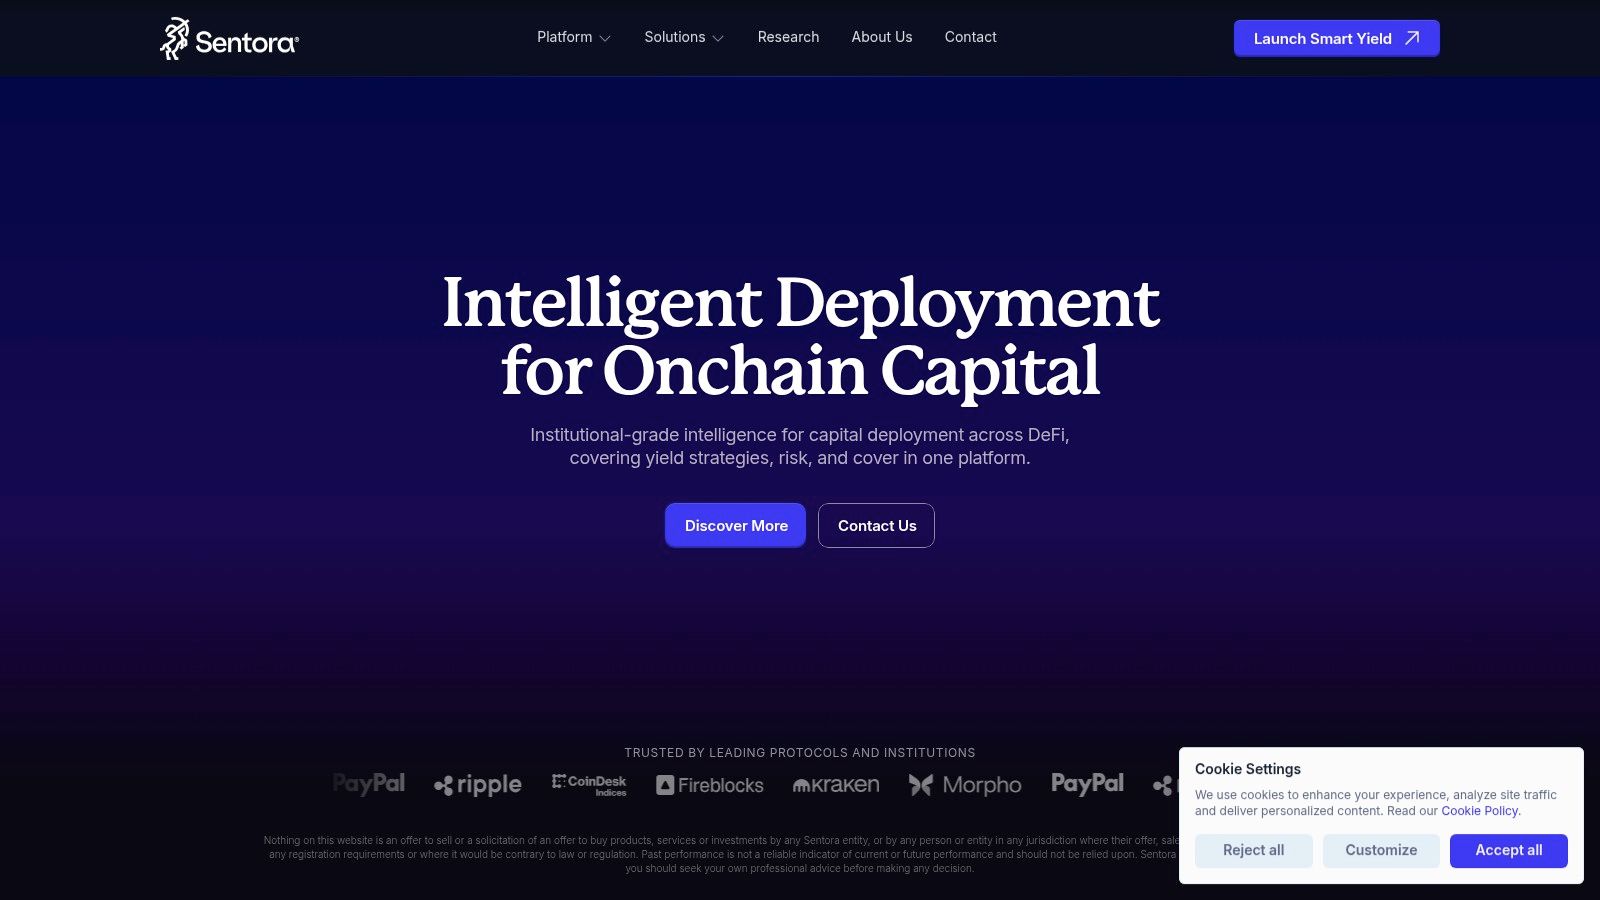
If you went looking for IntoTheBlock recently and found something else, this is why. IntoTheBlock merged with Trident Digital in May 2025, and the combined company now trades as Sentora, an institutional DeFi platform built on IntoTheBlock's analytics stack.
The underlying strength is the same one IntoTheBlock always had: a broad indicator library spanning on-chain, derivatives, DeFi, and social data, with token and protocol dashboards, screeners and API access, plus explanations of what each indicator means in trading terms. Many tools can show a metric; fewer help you understand what it means before you act on it.
The best use case is cross-checking behavior. If holder metrics, derivatives context, and social signals all line up, the setup is stronger than a single metric read in isolation. If they disagree, slow down.
What has changed is the audience. The merged company is aimed at institutions, funds, treasuries and DAOs, with yield strategies, structured lending and risk dashboards alongside the analytics. If you're an individual trader who used the old free IntoTheBlock dashboards, check what's still available on your plan before building a routine around it.
Pros
- Wide indicator coverage across multiple data types.
- Clear explanations help with interpretation.
- API access and dashboards support analysis.
Cons
- Now positioned for institutions rather than individual traders.
- Freshest data and advanced access require paid plans.
The 10 Crypto Market Analysis Tools Compared
| Product | Core features | UX / Quality | Value & Pricing | Target audience | Unique selling points |
|---|---|---|---|---|---|
| GeckoScreener 🏆 | Real-time screener (100+), 19 candlestick patterns, plain-language strategy builder, backtest (up to 9mo), portfolio mode | ★★★★ | Free builder + invite/paid access implied 💰 | Traders wanting fast idea-to-test workflow 👥 | ✨ No-code natural-language → runnable queries; integrated screening→backtest→share |
| TradingView | Advanced charting, Pine Script backtesting, screeners, server alerts | ★★★★★ | Free + paid tiers for pro features 💰 | Chart-focused traders, multi-asset users 👥 | ✨ Massive community scripts & wide exchange connectivity |
| TrendSpider | Automated trendlines/patterns, multi-timeframe scanners, no-code strategy testing | ★★★★ | Subscription tiers (best value at paid plans) 💰 | Rules-driven, automation-focused traders 👥 | ✨ Automated TA + visual trade-by-trade review |
| Messari | Asset profiles, curated research, sector datasets, APIs | ★★★★ | Enterprise-oriented pricing; pricey for individuals 💰 | Analysts, institutional researchers 👥 | ✨ Deep fundamental datasets + enterprise APIs |
| Santiment (Sanbase) | On-chain, social & dev metrics, screeners, alerts, API | ★★★★ | Free plan (30‑day lag) + paid realtime plans 💰 | Narrative/timing analysts and token researchers 👥 | ✨ Combines social, dev & on‑chain signals in one UI |
| Glassnode Studio | Deep on-chain metrics, Studio charts, API/CSV/Excel integrations | ★★★★★ | Tiered plans; upper tiers costly 💰 | Cycle analysts, institutional researchers 👥 | ✨ Point-in-time metrics and cohort/realized-cap analysis |
| CryptoQuant | Exchange flows, miner/derivative metrics, alerts, API | ★★★★ | Plan-based history/resolution; paid tiers for full access 💰 | Liquidity/flow analysts and traders 👥 | ✨ Strong exchange flow & derivatives signal coverage |
| Coin Metrics | Market + on-chain data, indices, Community & Pro APIs | ★★★★ | Free Community API (limits), Pro paid plans 💰 | Data engineers, quant analysts 👥 | ✨ Transparent methodologies & reference indices |
| Nansen | Labeled wallets, smart-money flows, token/NFT dashboards, alerts | ★★★★ | Feature-rich Pro plan (paid) 💰 | On-chain flow & NFT/token analysts 👥 | ✨ Wallet/entity labeling for smart‑money tracking |
| Sentora (ex-IntoTheBlock) | ML-driven on-chain/DeFi/derivatives/social indicators, token dashboards, API | ★★★ | Some advanced datasets behind paid plans 💰 | Institutions, funds and quant researchers 👥 | ✨ ML-based indicators with clear explainers |
Integrating Your Toolkit for a Winning Strategy
The best crypto market analysis tool is the one that fits your workflow, but in practice most serious traders need more than one. A charting platform like TradingView gives you the visual read, an all-in-one tool like GeckoScreener helps you screen and validate the setup, and an on-chain platform like Glassnode, CryptoQuant, or Nansen adds the context that tells you whether the move is backed by real participation. That layered approach matters because crypto doesn't reward isolated signals for long, and there are five distinct types of crypto analysis worth knowing before you decide which layers you actually need.
A strong stack also reduces false confidence. If a breakout looks clean on a chart but exchange flows, wallet behavior, or network activity don't support it, the trade deserves more skepticism. The same is true in the other direction, if on-chain data is turning before price catches up, you want a way to formalize that observation into a testable rule instead of treating it like a gut feeling.
The most effective traders now think in terms of workflow integration. They screen across a broad universe, confirm with chart structure, validate with historical behavior, and only then decide whether the trade deserves capital. That's why the category keeps moving away from single-purpose tools and toward platforms that can compress the whole loop into a repeatable process.
Fewer tabs. Better connected.
For active traders, the edge isn't owning more tabs. It's using fewer, better-connected ones.
If you want a cleaner path from scanning to strategy building to backtesting, GeckoScreener is built for that workflow. It keeps indicator filters, candlestick patterns, and historical validation in one place, so you can test ideas before you risk capital. Visit GeckoScreener and see how a tighter research loop can sharpen your next trade.
GeckoScreener Team
Written for the GeckoScreener community. Join us on Telegram →
Related Articles

Start screening cryptocurrencies for free
Apply strategies like this one in real-time across 250+ coins.
Try GeckoScreener →