Bollinger Bands Settings Explained for Crypto (2026)
Master Bollinger Bands settings for crypto trading. Learn canonical 20,2 setups, when to widen or narrow parameters, and how to build validated strategies.
GeckoScreener Team
Aug 9, 2026 · 14 min read
Updated about 2 months ago
You're staring at a crypto chart, the bands are squeezing, and the last breakout stopped you out before the move started. That's the usual frustration with Bollinger Bands settings. The bands look objective, but the settings decide whether they're describing the asset's real volatility or forcing a textbook shape onto a messy market.
Table of Contents
- Why Bollinger Bands Settings Matter More Than People Think
- What Bollinger Bands Measure
- The Canonical 20-Period 2 Standard Deviation Setup
- Common Alternative Settings by Timeframe
- Adjusting Settings for Crypto Volatility
- Three Trade Setups Using Different Settings
- Why You Should Validate Any Setting Before Trusting It
- Quick Reference and What Comes Next
Why Bollinger Bands Settings Matter More Than People Think
A trader opens a 15-minute BTC chart, sees the bands coil tighter, and takes the first upside break. The candle closes above the upper band, the position fills, and price snaps right back into the range. That loss does not mean Bollinger Bands are broken. It usually means the settings were treated like a universal truth instead of a calibration choice.
Bollinger Bands are a formula with three controls, the lookback period, the standard deviation multiplier, and the price source. Change any one of them, and the shape of the bands changes, which changes every breakout, squeeze, and mean-reversion signal that follows. That is why two traders can look at the same chart and see different setups, even though they are both using the same indicator name.
Practical rule: if the bands keep faking you out, do not blame the indicator first. Ask whether the settings fit the asset's volatility and the chart timeframe.
A short lookback makes the bands react faster. That can help on noisy charts, because price changes show up sooner, but it also creates more whipsaws. A wider deviation multiplier gives price more room before the bands get tagged, which can help on volatile crypto pairs, but it can also slow the signal down enough to miss the move you wanted to catch.
The question is not “What is the best preset?” It is “What combination of settings describes this market?” A chart can look precise and still be poorly matched to the asset in front of you. For a practical way to read that chart structure before you adjust anything, see this guide to how to read crypto charts.
What Bollinger Bands Measure
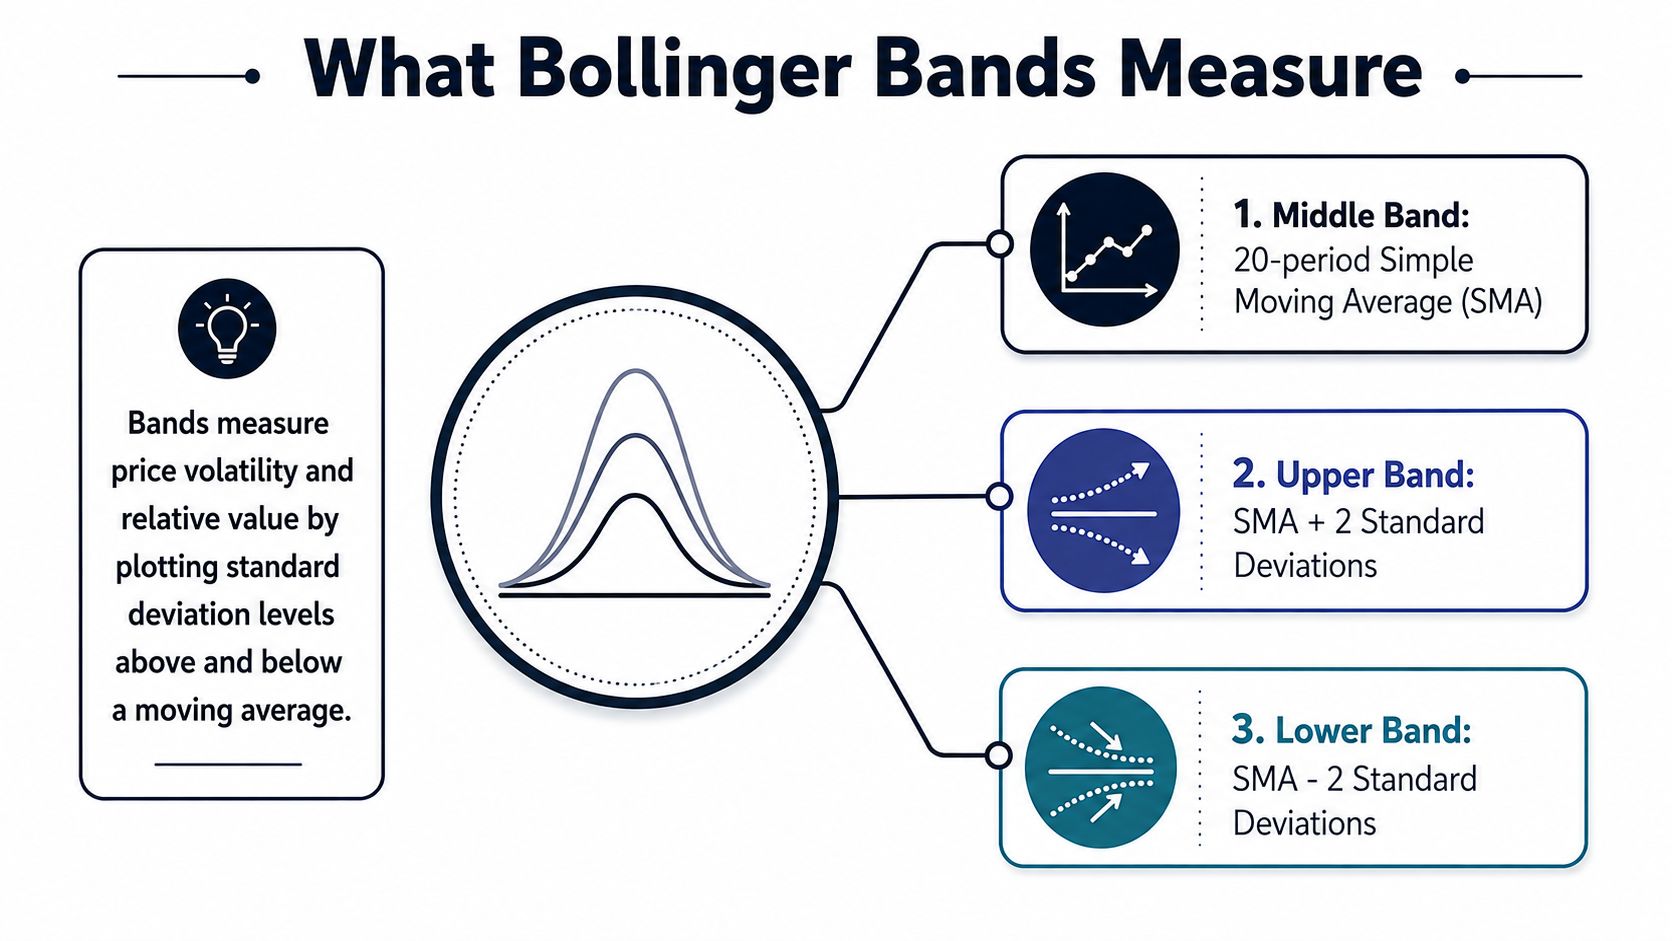
Bollinger Bands work like a weather map for price. The middle band marks the recent average, while the outer bands mark how far price has stretched beyond that average during the chosen lookback window. When volatility rises, the bands spread apart. When price gets quieter, they pull back together.
The middle line is a simple moving average, usually built from closing prices. It smooths recent noise so the baseline is easier to see. The upper and lower bands come from adding and subtracting a multiple of standard deviation, which measures how far price usually moves away from that baseline within the lookback window.
Here's the cleanest way to read the three parts:
- Middle band: the average price over the selected period.
- Upper band: the average plus a volatility buffer.
- Lower band: the average minus that same buffer.
The price source matters because most charting tools start with closes by default. If you switch the source, you change the input that feeds both the average and the deviation, so the same chart can behave differently even when the indicator name stays the same. The indicator is a calculation built from specific inputs.
That calculation has three moving parts. Period controls smoothing, standard deviation controls width, and price source controls what data the math sees. If you can explain those three jobs in your own words, you already understand more than many traders who only memorize presets. For a broader chart-reading foundation, this crypto chart guide helps connect the indicator to price structure.
The Canonical 20-Period 2 Standard Deviation Setup
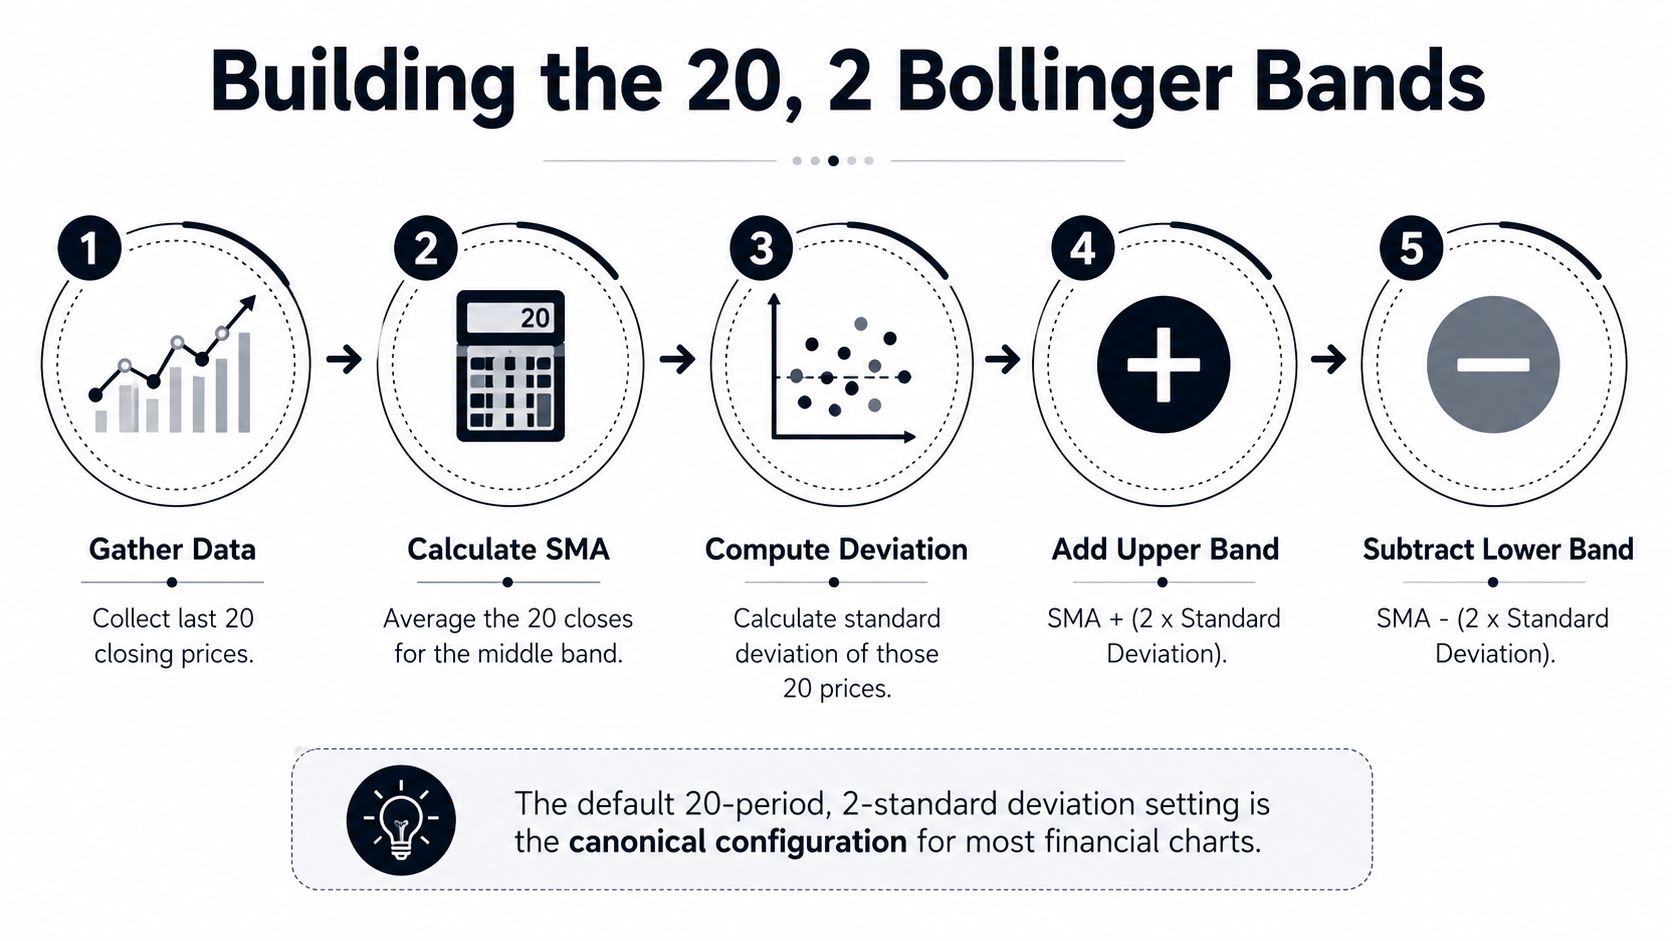
The classic setup is 20 periods with 2 standard deviations. StockCharts describes the middle band as a 20-day SMA, with the upper band at the 20-day SMA plus 2 times the 20-day standard deviation, and the lower band at the same SMA minus 2 times the deviation (StockCharts Bollinger Bands reference). Bollinger's own materials say those defaults have stayed in place for roughly 35 years, which is why the setting feels like a market standard rather than a random convention (Bollinger history note).
How the math works
Take the last 20 closes. Average them to get the middle band. Then measure how spread out those same 20 closes are from that average. That spread is the standard deviation. The upper band is the average plus 2σ, and the lower band is the average minus 2σ.
A small hand example makes the structure obvious. If the 20-close average were 100 and the standard deviation were 5, the upper band would sit at 110 and the lower band at 90. That doesn't mean price must stay inside those lines, it means the indicator is drawing a volatility envelope around the average.
The choice of 20 is practical, not mystical. Bollinger explained it as roughly one trading month, which gives the bands a window long enough to smooth noise without flattening everything into a slow blur. The 2.0 multiplier is there to scale the envelope with volatility instead of using fixed-width offsets.
Useful shortcut: if you can compute a moving average, you can compute Bollinger Bands. The bands are just the average plus and minus a volatility measure.
A separate academic paper also defines the default as (20, 2) and treats the first number as the lookback length and the second as the standard-deviation multiplier (academic definition note). That's the heart of the indicator. Every alternative setting is just a different answer to the same question, how much recent price behavior should the bands try to contain?
Common Alternative Settings by Timeframe
A chart can look calm on one timeframe and noisy on another, so the setting has to match the behavior you are watching. Fidelity describes 10-day SMA with 1.5 standard deviations for short-term use, 20-day SMA with 2 standard deviations for medium-term use, and 50-day SMA with 2.5 standard deviations for longer-term use (Fidelity and Dukascopy guidance). Dukascopy also points out that shorter periods, like 10, react faster, while longer ones, like 50, smooth more noise for swing trading.
A simple comparison
| Period | Standard Deviation | Best Timeframe | Typical Use |
|---|---|---|---|
| 10 | 1.5 | Short-term | Faster signals, more sensitivity |
| 20 | 2 | Medium-term | Balanced default for many charts |
| 50 | 2.5 | Longer-term | Smoother trend context, less noise |
The practical trade-off is straightforward. A shorter period keeps the bands close to price, so they respond sooner but also produce more signals. A longer period works more like a slow filter, which can help reduce noise but can also delay entries and exits.
The deviation setting changes band width. OANDA explains that 1σ contains roughly 65% of price action, 2σ about 95%, and 3σ almost 99% (OANDA Bollinger Bands guide). That is why the multiplier is not a cosmetic detail. It changes how much movement the bands are willing to absorb before price looks unusual.
For traders, that changes how the chart feels. A 10, 1.5 setting behaves like a quick reflex, catching smaller swings sooner but demanding more filtering. A 50, 2.5 setting behaves like a wide-angle lens, giving more context and fewer signals. The 20, 2 default sits in the middle because it balances responsiveness and stability better than many basic alternatives.
Adjusting Settings for Crypto Volatility
Crypto rarely behaves like a sleepy equity chart. When volatility expands quickly, the default 20, 2 setting can get clipped by false breakouts, and when volatility compresses, the same setting can leave the bands too tight to feel useful. The better question is which settings fit the coin, the timeframe, and the current market regime.
Why volatile assets need different calibration
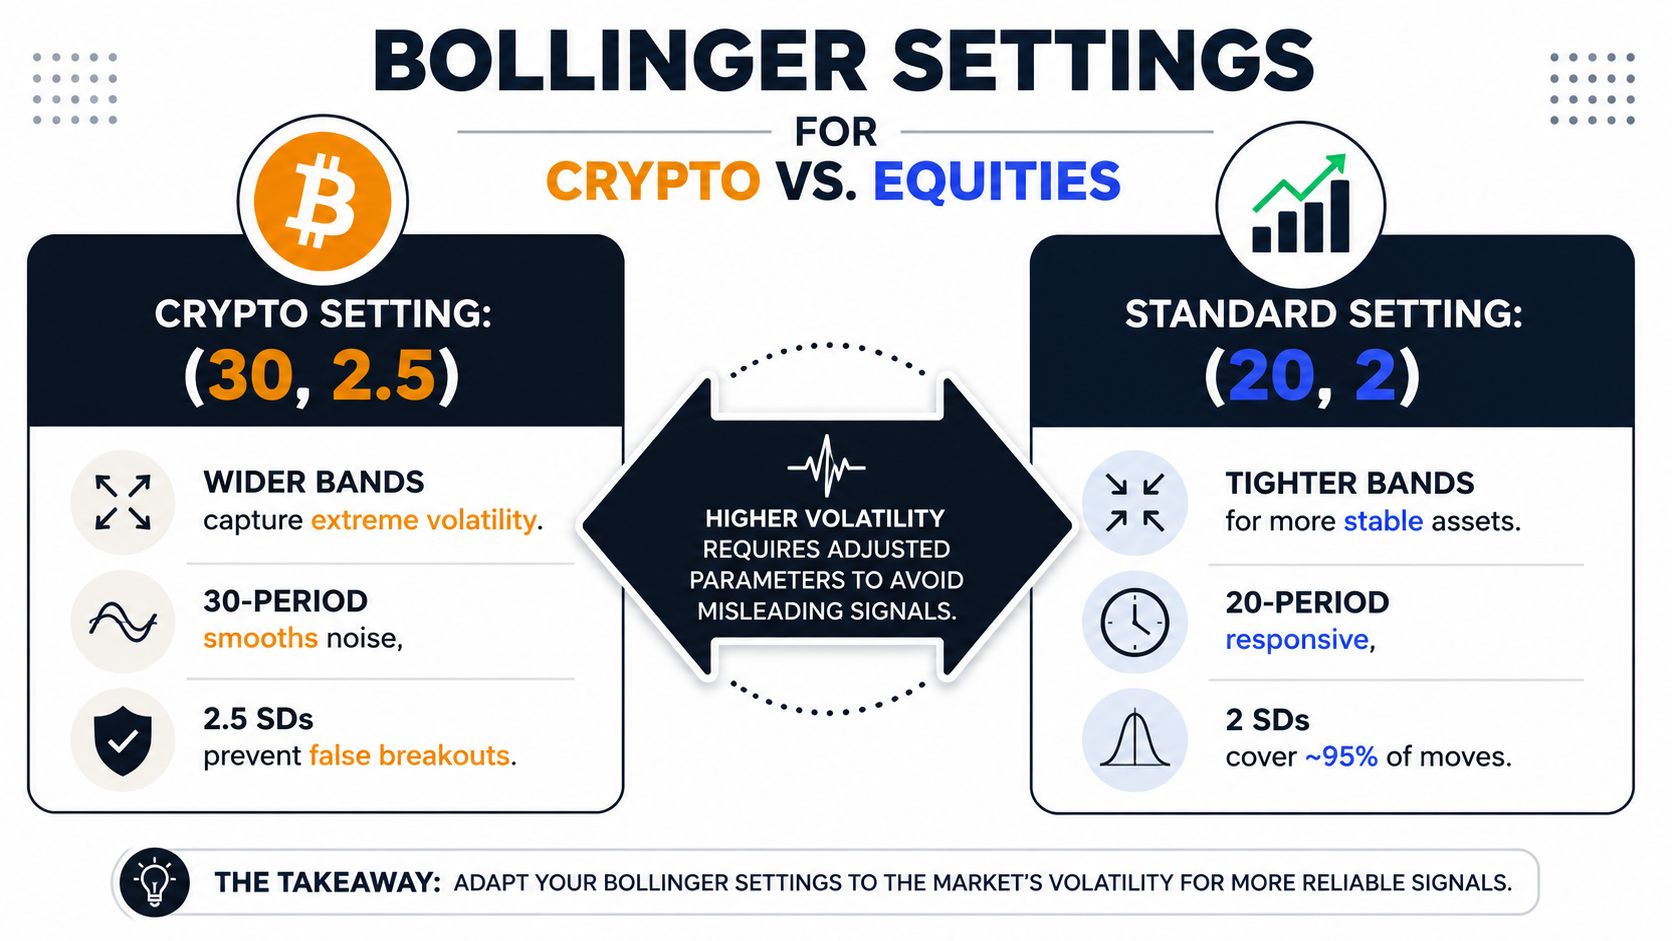
Standard deviation already adapts to recent movement, but the trader still chooses how aggressively that adaptation should behave. A wider multiplier gives price more breathing room. A shorter lookback makes the bands react faster to changing conditions. In crypto, that often means using a shorter period and a larger deviation than you would on a steadier market.
Independent trading guidance often points toward faster crypto charts using 10 to 14 periods and 2.5 to 3.0σ for very volatile conditions, while steadier markets often stay near 20, 2. That does not promise profit. It reflects a simple fit between the indicator and the asset's behavior.
The key distinction is clear. Volatility changes the bands, and it also changes what a tag, a squeeze, or a breakout means. A price touch on a calm chart can carry real information. The same touch on a frantic chart can be little more than noise.
Trader's rule of thumb: if the market is jumping around more than usual, shorten the period and widen the deviation. The goal is to keep the bands from becoming too reactive.
A settings pair should match the swing structure in front of you. Treating the indicator like a fixed ruler makes normal movement look exceptional, which leads to poor reads on squeezes and breakouts. Tuned to the asset, the bands give a clearer map of where price is stretched and where it still has room to move. The same logic applies when you compare a regular stop with a trailing stop loss, because both tools work better when they fit the way price moves.
Three Trade Setups Using Different Settings
The useful way to think about Bollinger Bands is by job, not by prestige. Different settings do different work. A squeeze breakout wants a broader context, a scalp wants quicker feedback, and a trend ride wants room for price to breathe.
Squeeze breakout on the 4-hour chart
Use 20, 2 here. Wait for the bands to contract to their narrowest range in the last 100 candles, then let price close outside the band before entering. Put the stop on the opposite side of the squeeze or behind the middle band, depending on how much room the structure gives you.
This setup fits traders who want expansion after compression. The mistake is jumping in on the first wick outside the band. Crypto loves fake-outs right at the edge of a squeeze, especially when the candle hasn't closed cleanly yet.
Mean reversion scalp on the 15-minute chart
Use 10, 1.5 here. In an uptrend, wait for a lower-band tag with momentum confirmation, then target the middle band rather than trying to catch a huge move. The stop should stay tight enough that a failed bounce doesn't turn into a slow bleed.
This setup works because short-term price often snaps back toward the average. The common mistake is using it in a strong trend without context. A lower-band touch in a strong downtrend is not automatically a bargain.
Trend ride on the daily chart
Use 50, 2.5 here. Enter pullbacks toward the lower band only when the broader structure is still making higher highs. Exit on a touch of the upper band or when momentum weakens enough to show the trend is tiring.
This setup gives a trend more space. It's slower, but it helps you avoid getting shaken out by routine pullbacks. If you want a clean comparison of how exit style affects these trades, this stop-loss versus trailing-stop guide is worth reading alongside the chart.
Common mistake across all three: treating the band touch as the signal by itself. The band is the location. The setup still needs structure, context, and a clear exit plan.
Why You Should Validate Any Setting Before Trusting It
A chart can make a setting look convincing long before it proves useful. One popular write-up claims a 55% win rate for a 10, 2, 2 daily setup, while another argues for 20 SMA / 2σ on a 60-minute chart (evidence-quality note). Those claims can both sound reasonable and still fail to generalize, because they rest on different methods, timeframes, and assumptions.
What validation actually looks like
Start with one exact settings combination. Define the full rule set, entry, stop, exit, and any confirmation filters. Then test it across multiple coins and multiple market regimes so you can see whether the idea survives outside one lucky window.
A setting is only useful if it works inside a complete trading plan. The band values tell you how much movement to expect around the average, but they do not tell you when to enter, where to exit, or whether a touch is meaningful in that specific market. A setup that works on a quiet pair can fall apart on a volatile one, just as a setup that fits a trend can fail in a choppy range.
The goal is to learn whether the setting still behaves when the market gets messy, quiet, trending, and mean-reverting. Historical testing will not guarantee future results, but it will usually expose obvious weak spots before you commit capital.
That is why reproducibility matters. If you cannot repeat the test, you cannot trust the result. If you cannot explain the rule set in plain language, you probably cannot compare one setting against another with any discipline.
To learn how to set up historical tests, see our guide on how to backtest trading strategies. For traders who want to evaluate crypto setups in one place, GeckoScreener is a web-based platform for screening cryptocurrencies and building historical strategy tests across the top 100 coins, with data that refreshes every 60 seconds. That does not make a setting good by itself, but it does give you a way to test whether a combination behaves the way you expect before you risk money on it.
Quick Reference and What Comes Next
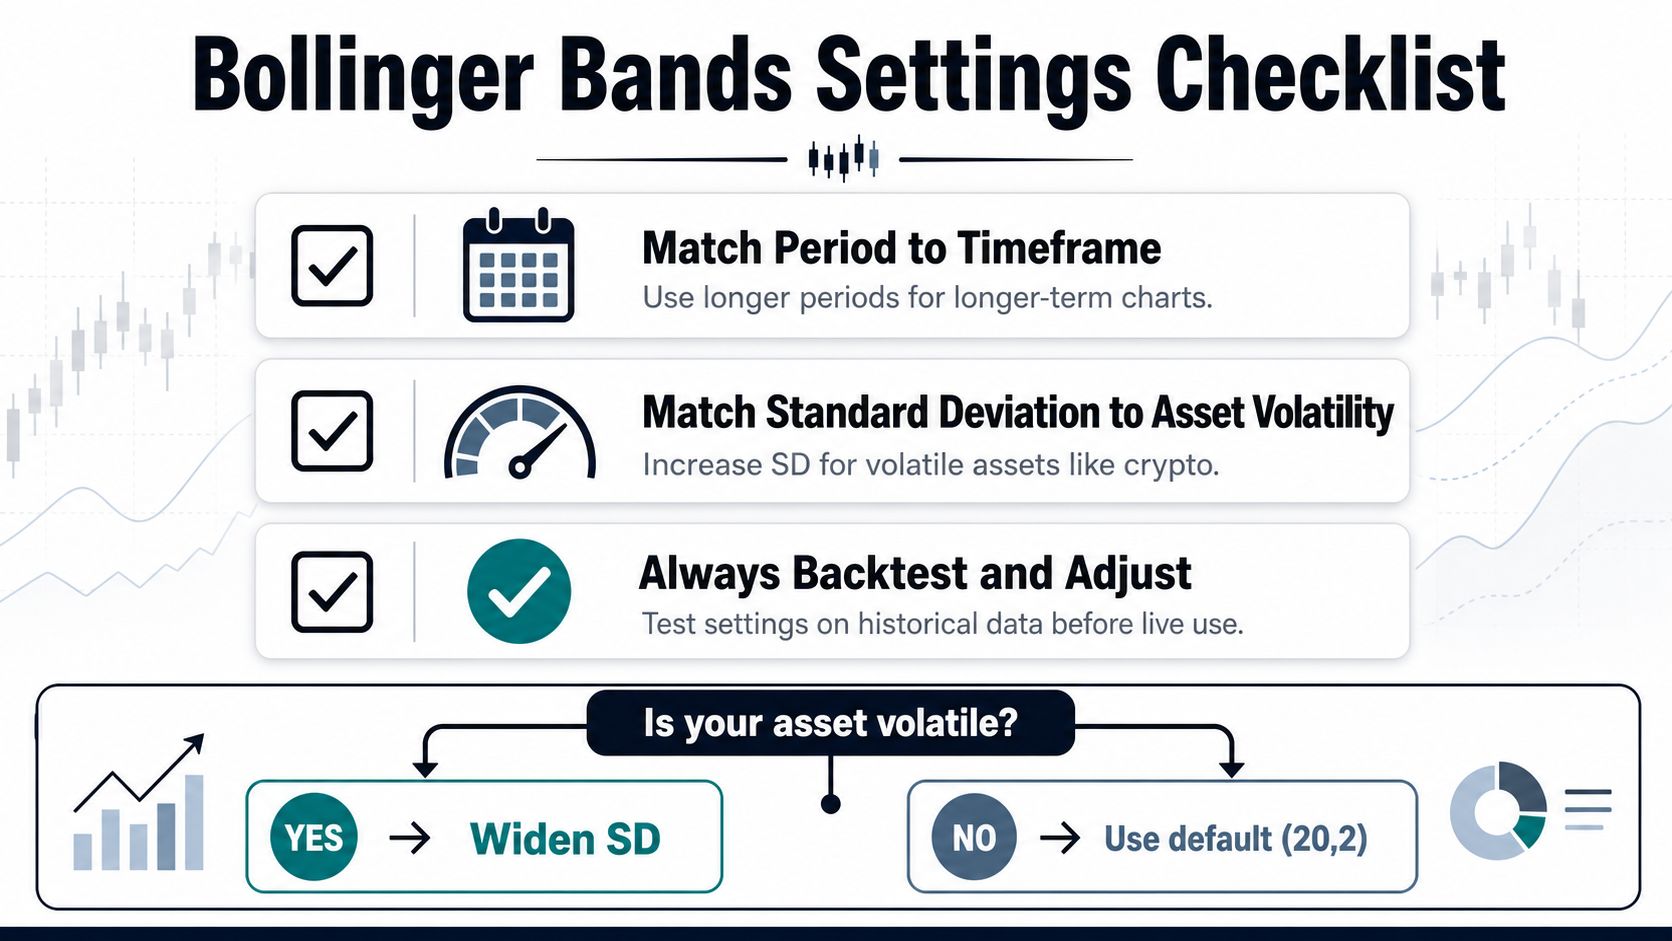
A chart can look clean at first and still give you the wrong read if the Bollinger Bands settings do not match the asset in front of you. The quick check below keeps the decision grounded in market behavior instead of habit.
- Match the period to the chart: longer timeframes usually need smoother settings because each candle carries more information.
- Match the deviation to volatility: more volatile assets need more room, or price will push through the bands too often.
- Always test the full idea: a setting only matters inside a complete rule set, including entry, exit, and filter rules.
A simple decision rule helps. If the asset is noisy, widen the deviation. If the chart feels too slow, shorten the period. If you do not know whether the combination works, test it before you trust it.
The math stays the same from market to market. What changes is the amount of movement the bands need to contain before the signal looks useful instead of random. That is why the best settings are the ones that fit the asset, the timeframe, and the trade plan together.
Historical testing and alerts will be available soon, which will make it easier to compare settings against past crypto behavior and spot setups as they form. If you want a place to screen coins, shape a rule set, and prepare for that workflow, visit GeckoScreener and start with the chart behavior you want to trade.
GeckoScreener Team
Written for the GeckoScreener community. Join us on Telegram →
Related Articles
Start screening cryptocurrencies for free
Apply strategies like this one in real-time across 250+ coins.
Try GeckoScreener →