Trade Crypto Better Using MACD Signals and GeckoScreener
Learn how to trade crypto better with MACD signals, crossovers, and divergences. Includes real chart examples and screening tips from GeckoScreener.
GeckoScreener Team
Aug 20, 2026 · 15 min read
Updated about 2 months ago
Can a MACD crossover really help you trade crypto better, or are you just reacting to a colored line after the move has already happened?
Most traders learn MACD as a three-part chart decoration. The blue line crosses the orange line, the histogram changes color, and an entry follows. That approach misses the core problem. In crypto, a signal must survive fast momentum shifts, uneven liquidity, fees, slippage, and sudden changes in market regime.
Crypto is no longer a niche experiment. One widely cited market-sizing report estimated 774 million global crypto owners in June 2026, compared with 741 million in December 2025, while another 2026 adoption summary placed ownership near 559 million people, or roughly 9.9% of the internet population. The estimates use different methods, but both point to a globally material market with hundreds of millions of participants, as reported through CoinDesk Data's market research.
That scale creates more opportunities, but it also creates more noise. The useful question isn't whether MACD “works.” It's whether you can identify the market conditions where its signal deserves attention, then test the idea across enough assets to separate repeatable behavior from one attractive chart.
Table of Contents
- Why MACD Still Matters for Crypto Traders
- How MACD Is Calculated and What Each Line Means
- Reading MACD Crossovers and Divergences in Crypto Markets
- Real Chart Examples of MACD Signals on Crypto Assets
- MACD Limitations Every Crypto Trader Should Know
- Screening for MACD Setups Across the Top 100 Coins
- Building a Repeatable MACD Trading Workflow
Why MACD Still Matters for Crypto Traders
MACD gets dismissed as a lagging indicator because it uses moving averages. That criticism is technically correct, but incomplete. Every moving-average signal reacts after price has moved. The important issue is whether the delay helps you capture a sustained momentum shift or merely gets you trapped in a short-lived crypto spike.
MACD remains useful because it measures the relationship between two speeds of price movement. A fast average responds to recent buying or selling pressure. A slower average provides a broader reference. When the gap between them expands, momentum is accelerating. When the gap contracts, the trend may be losing force.
Crypto's volatility makes that distinction harder, not irrelevant. A sharp candle can pull the fast average upward, trigger a crossover, and then disappear as quickly as it arrived. A trader who treats every crossover as an instruction will confuse acceleration with durability.
Volatility changes the quality of a signal
Liquidity matters because execution quality affects whether a theoretical signal can become a practical trade. Recent cryptocurrency-market research describes a U-shaped intraday pattern in liquidity and realized volatility and reports a strong negative relationship between them. In practical terms, rising volatility tends to accompany weaker liquidity, which can mean wider execution costs and more fragile indicator behavior, as discussed in research on crypto liquidity and volatility.
That relationship changes how you should read MACD. A bullish crossover during orderly expansion deserves more scrutiny than one printed during a thin, disorderly move. The indicator may calculate correctly in both cases, but the trade's fill, stop placement, and follow-through can differ sharply.
For a broader comparison of momentum, trend, and volatility tools, see this guide to the best indicators for crypto trading. MACD earns its place in that conversation because it can describe momentum direction, momentum strength, and momentum deterioration through one connected structure.
Practical rule: MACD isn't a crystal ball. Treat it as a momentum filter, then ask whether price structure and liquidity support the message.
How MACD Is Calculated and What Each Line Means
MACD looks complicated only when the three components are presented without context. The standard construction is straightforward:
- Calculate the 12-period exponential moving average, or EMA.
- Calculate the 26-period EMA.
- Subtract the 26-period EMA from the 12-period EMA.
- Calculate a 9-period EMA of the MACD line, called the signal line.
- Display the difference between the MACD line and signal line as the histogram.
The core formula is:
MACD line = 12-period EMA minus 26-period EMA
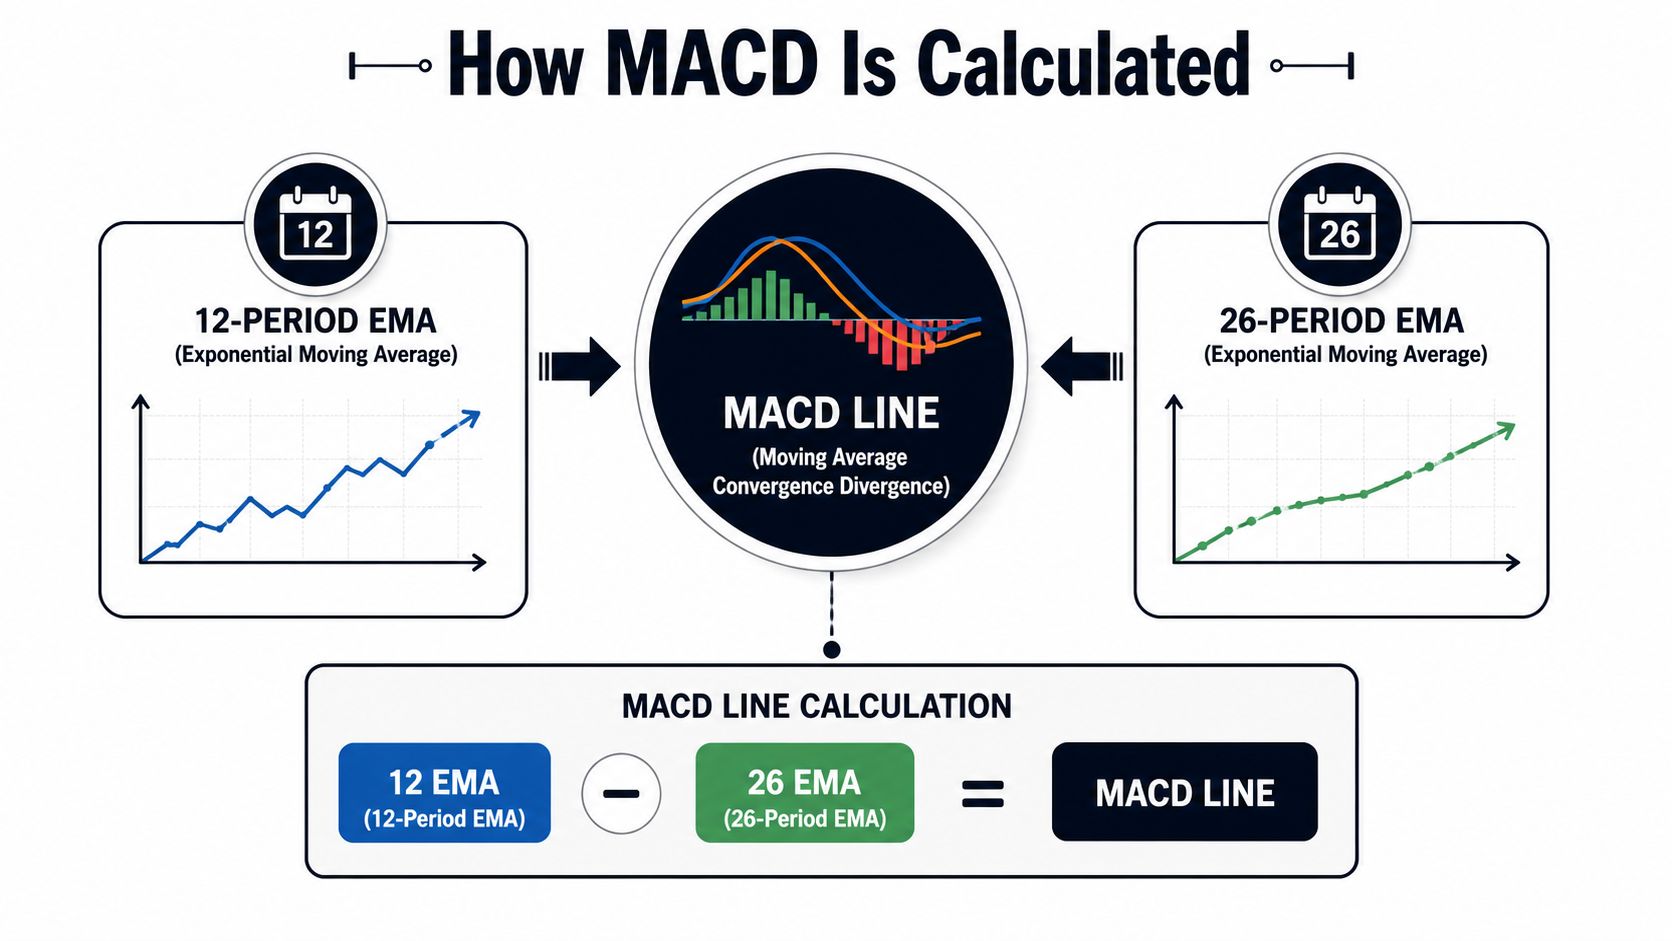
The 12-period EMA reacts faster because it gives more weight to recent prices. The 26-period EMA moves more slowly, so it represents the broader direction. When the 12-period EMA rises above the 26-period EMA, the MACD line moves above zero. When it falls below the slower average, the MACD line moves below zero.
A simple crypto example
Suppose a hypothetical asset, NovaCoin, trades sideways for several candles. Its 12-period EMA sits close to its 26-period EMA, so the MACD line remains near zero. The histogram stays small because the MACD line and signal line are close together. This is a market without strong directional separation.
Now NovaCoin breaks upward and closes strongly. The 12-period EMA responds first and rises faster than the 26-period EMA. The MACD line climbs. At first, it may still sit below the signal line because the signal line is a smoothed version of the MACD line. Once the MACD line crosses above that 9-period signal line, the histogram turns positive.
If buying continues, the distance between the two lines expands and the histogram grows. That expansion tells you bullish momentum is strengthening. It doesn't tell you how far price will travel, and it doesn't guarantee that the next candle will rise.
Later, price consolidates. The fast EMA stops pulling away from the slow EMA, so the MACD line flattens. The histogram contracts even if price remains above its earlier breakout level. That contraction is a warning that momentum is cooling, not necessarily that the trend has already reversed.
If NovaCoin then sells off, the MACD line can cross below the signal line and eventually move below zero. The cross describes a short-term momentum shift. The move through zero describes a deeper change in the relationship between the fast and slow averages.
The guide to reading crypto charts can help you place those lines alongside price structure rather than viewing MACD in isolation.
Reading MACD Crossovers and Divergences in Crypto Markets
A MACD signal has more value when you rank it by context. Three patterns appear repeatedly: the bullish crossover, the bearish crossover, and divergence.
A bullish crossover occurs when the MACD line moves above the signal line. Traders often interpret it as improving momentum. A bearish crossover occurs when the MACD line falls below the signal line, suggesting weakening momentum.
The mechanics are simple. The judgment isn't.
Crossovers are not equal
On a lower timeframe, crypto price can swing back and forth around the moving averages. The MACD line crosses the signal line, then crosses back before a meaningful trend develops. This is the classic whipsaw. It becomes more common when price consolidates, when volatility rises without directional follow-through, or when liquidity weakens.
A crossover above the zero line may carry more weight for a swing trader than a crossover deep below zero, because the broader relationship between the fast and slow averages already supports bullish conditions. The reverse applies to bearish setups. This isn't a guarantee. It's a way to distinguish a momentum improvement inside an established uptrend from a small bounce inside a larger decline.
Divergence can expose exhaustion
Regular bearish divergence appears when price makes a higher high while MACD, or its histogram, makes a lower high. Price is still advancing, but momentum isn't matching the new peak. Regular bullish divergence reverses that logic, with price making a lower low while MACD forms a higher low.
Hidden divergence compares momentum behavior with a continuing trend. It can support trend continuation rather than signal a major reversal. Traders often overvalue any two-line disagreement, but divergence needs clear swing points and enough separation to matter.
Academic research supports the broader idea that candlestick and momentum formations can contain measurable short-horizon information in crypto. One study examined about 200 million hourly observations across nearly 400 cryptocurrencies, 2,000 trading pairs, and 36 exchanges from 2018-07 to 2022-01, finding statistical associations between several reversal patterns and next-period returns. The researchers used the stepwise superior predictive ability test to reduce data-snooping risk, as described in the cryptocurrency candlestick-pattern study.
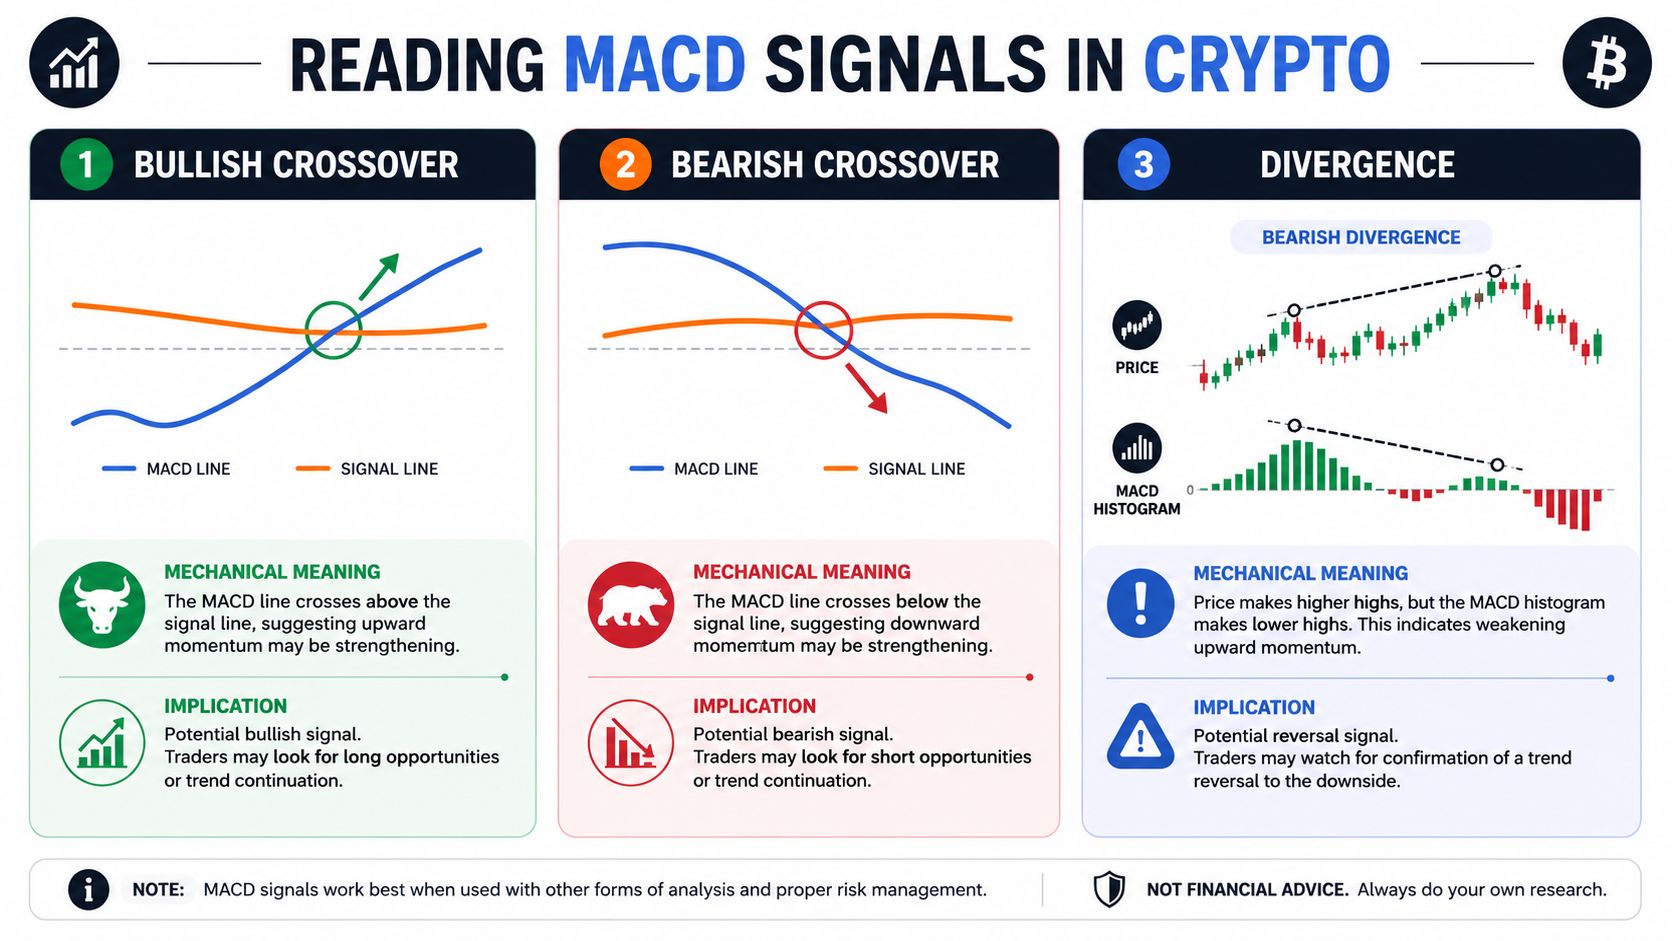
Signal hierarchy: A crossover plus supportive price structure is more informative than a crossover alone. A divergence plus a failed breakout, weakening volume, or a clear resistance level deserves closer inspection than a divergence floating in the middle of a range.
Real Chart Examples of MACD Signals on Crypto Assets
A clean textbook chart can make MACD look decisive. Actual crypto charts are less polite. The same pattern can produce continuation, reversal, or a fast loss depending on where it appears and what price does next.
Consider a bullish crossover on a liquid major asset after price has reclaimed a previous resistance area. The MACD line crosses above the signal line, the histogram expands from near zero, and candles hold above the reclaimed level instead of immediately falling back through it. A trader doesn't need to buy the instant the lines cross. The better question is whether the breakout level becomes support and whether volume confirms participation.
A second example is bearish divergence near a local high. Price pushes to a fresh peak, but the MACD histogram peak is lower than the previous one. That divergence doesn't prove an immediate collapse. It says the latest price advance has weaker momentum behind it. A cautious trader waits for a break of nearby support or a bearish crossover before treating the warning as an actionable setup.
The third example is the trap most retail traders remember. Price moves sideways after a brief upward burst. MACD crosses bullishly, but the fast average has no room to separate from the slow average. The histogram turns positive for a short period, then contracts and flips negative. A trader who entered on the cross alone bought noise inside a range.
What to inspect beside the indicator
Use the chart as a decision panel, not a MACD-only test:
- Price structure: Is price making higher highs and higher lows, or is it trapped between obvious boundaries?
- Breakout quality: Did price close beyond resistance, or merely spike through it?
- Volume behavior: Did participation expand with the move, or did the candle arrive without confirmation?
- Higher-timeframe direction: Does the signal align with the broader trend?
- Liquidity conditions: Could a sudden move produce poor fills or a stop trigger before follow-through?
Named candlestick patterns can add another layer of context. Academic work on crypto has identified patterns including Hammer Bullish, Rising Window Bullish, On Neck Bearish, and Shooting Star as especially meaningful in its analysis, according to this cryptocurrency candlestick research paper.
The lesson from these chart scenarios is blunt: MACD can help you recognize a change in momentum, but price decides whether that change becomes a tradeable move.
MACD Limitations Every Crypto Trader Should Know
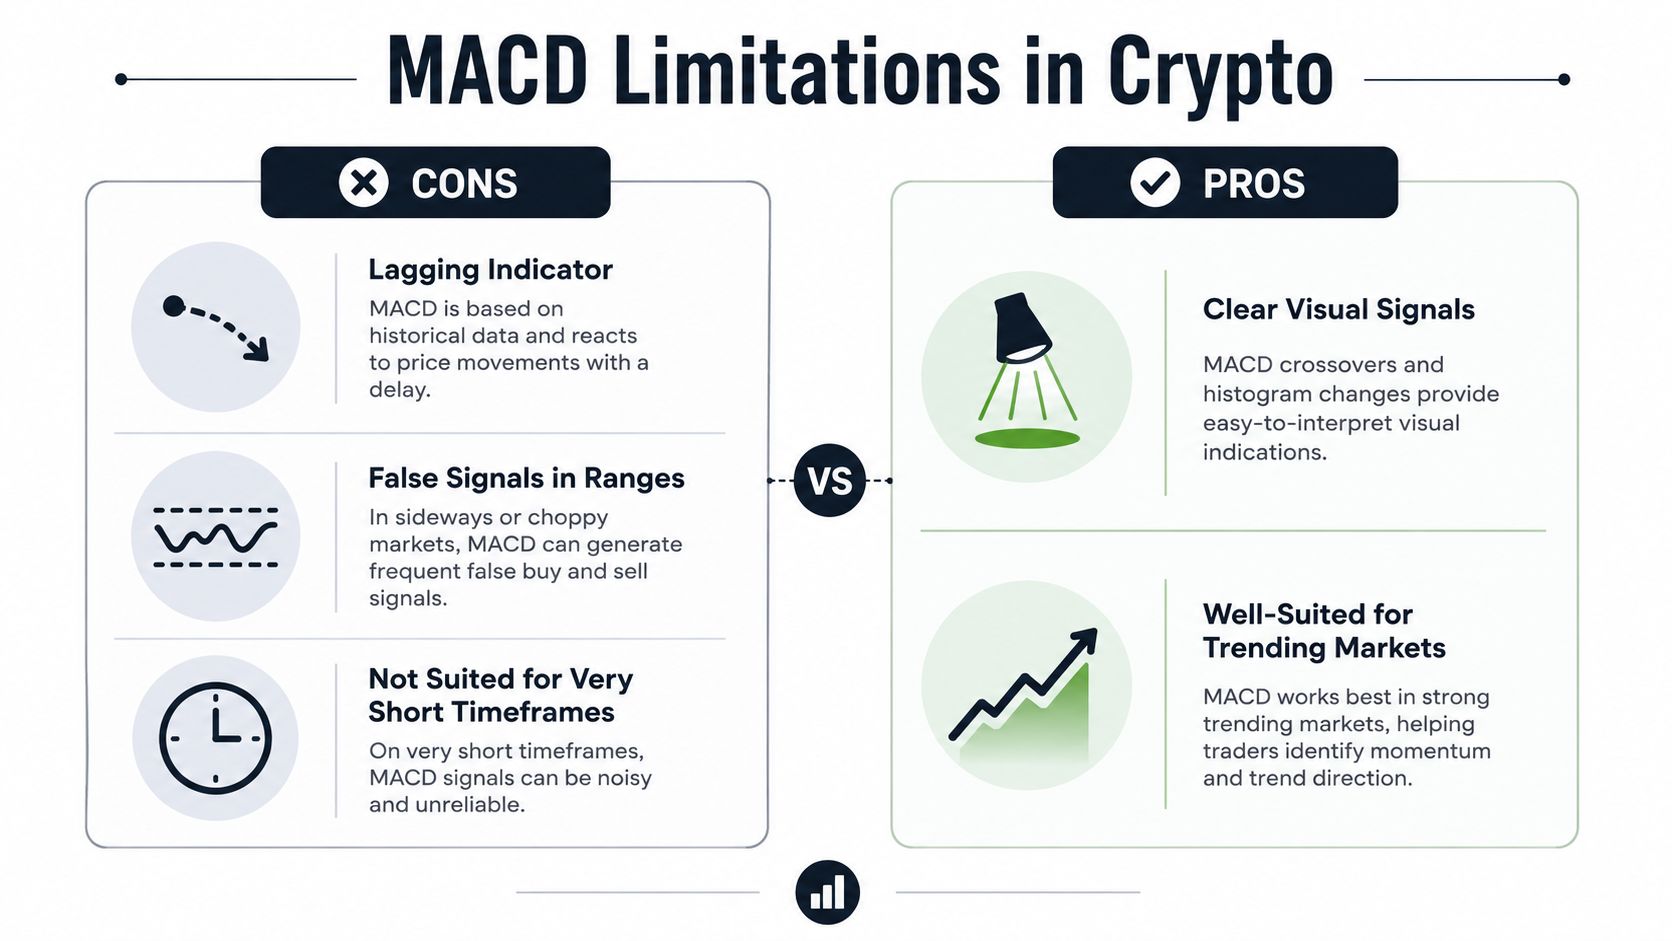
MACD's biggest weakness is also its design. Moving averages smooth price, and smoothing creates delay. By the time a crossover confirms a move, part of the move may already be gone. That trade-off is acceptable when the market trends long enough to compensate for the delay. It becomes painful when crypto snaps back before the signal develops.
The second weakness is range-bound whipsaw. When price oscillates around a stable area, the 12-period and 26-period EMAs repeatedly converge and separate by small amounts. MACD then generates a sequence of visually clear signals with little directional value.
Strengths and weaknesses side by side
| MACD can help with | MACD cannot reliably provide |
|---|---|
| Identifying a shift in momentum | Exact tops and bottoms |
| Comparing fast and slow price movement | Guaranteed follow-through |
| Visualizing momentum expansion through the histogram | Protection from slippage |
| Supporting trend-following decisions | A complete risk-management plan |
Short timeframes create another problem. A candle can contain a rapid move, a retracement, and a recovery that the closing price compresses into one data point. Independent backtesting guidance notes that short-term strategies may require tick-level data because 1-minute candles can miss execution details, while realistic tests should account for fees and slippage, as explained in this crypto backtesting guide using real market data.
Liquidity adds a practical constraint. When volatility rises and liquidity weakens, a stop-loss may fill differently from the level you planned. MACD won't show that execution gap. It only reflects the price series supplied to it.
Use MACD when: price is trending, the signal aligns with structure, and the market has enough liquidity for your rules to be executed sensibly.
Stand aside when: price is chopping sideways, the crossover is isolated, or the move depends on a thin and unstable market.
A confirmation tool doesn't need to be another oscillator. Support and resistance, volume, candlestick structure, and higher-timeframe direction can all challenge a weak MACD reading. The indicator is most useful when it narrows your decisions, not when it replaces them.
Screening for MACD Setups Across the Top 100 Coins
Reading one chart carefully is manageable. Checking more than 100 crypto assets for the same MACD condition, then comparing structure, volume, and momentum, is where manual analysis breaks down.
GeckoScreener provides a real-time crypto screener covering 100+ coins in one sortable table. It can filter by MACD, RSI, ADX, EMA, volume, and price-action conditions, while data refreshes every 60 seconds according to the publisher's product information. The point isn't to outsource judgment. It's to reduce the time spent locating candidates.
Build the screen around a condition
Start with a precise question rather than a vague preference:
- Momentum shift: Find assets where MACD has crossed above the signal line.
- Trend support: Add an EMA or ADX condition to separate directional markets from weak movement.
- Momentum confirmation: Add an RSI condition, but don't treat an RSI reading as proof that the trade will continue.
- Participation check: Filter for volume behavior that supports the move.
- Price location: Exclude assets that are crossing directly into an obvious resistance area.
The plain-language strategy builder translates an idea into a runnable query without requiring code. That matters because vague rules create inconsistent decisions. “Find bullish MACD coins” leaves too much interpretation to the trader. “Find a bullish crossover with trend and volume confirmation on the selected timeframe” gives you a repeatable starting point.
Sort candidates before opening charts
A screener is a funnel. It should narrow the field, not declare a winner. Sort the results by the factors that matter to your plan, then open individual charts and inspect the signal's location, candle closes, liquidity, and invalidation point.
Don't confuse a fresh screen with a tested edge. Consumer research cited in the crypto adoption discussion found that knowledge gaps, volatility, and security concerns remain major barriers for retail users, while recent retail-trading research indicates that traders can behave differently in cryptocurrencies than in stocks and gold. That supports a methodical workflow, not a promise that one familiar indicator transfers cleanly across markets. The broader context appears in this analysis of recurring crypto-user questions and trading concerns.
GeckoScreener can serve as one screening option in that workflow. It brings indicators, candlestick detection, strategy rules, and market scanning into one interface, but the trader still has to define the setup and reject poor chart context.
Building a Repeatable MACD Trading Workflow
What separates a useful MACD signal from chart noise in crypto? A repeatable process that screens broadly, checks context, and defines risk before an entry. Volatility can turn a crossover into a false start within a few candles, so treat the signal as a candidate, not a decision.
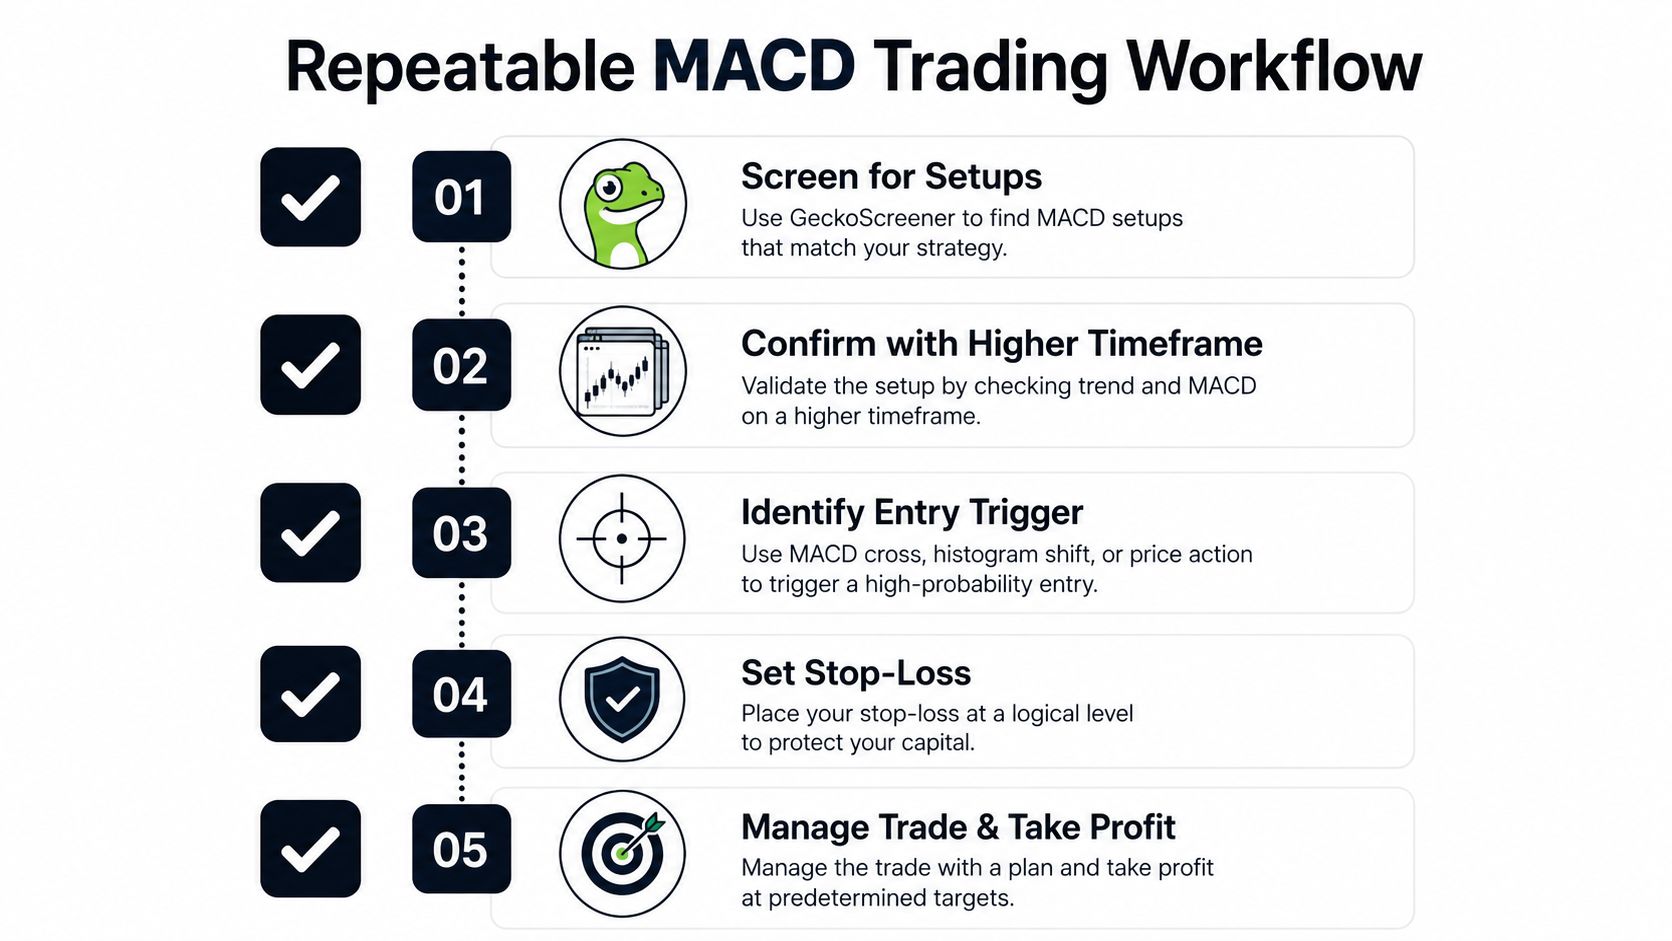
Use this sequence:
- Screen for setups across 100+ coins with defined MACD conditions.
- Confirm structure on a higher timeframe and check trend, volume, and liquidity.
- Define the trigger, such as a candle close after the crossover.
- Set the stop-loss where the trade thesis fails.
- Manage the position with a stated take-profit or exit rule.
Backtesting compares those rules with historical market data before capital is at risk, as explained in this introduction to crypto strategy backtesting. GeckoScreener's backtesting engine lets you test the workflow across historical data. Use this crypto strategy backtesting guide to structure the test rather than selecting rules after seeing a favorable chart.
Record the signal, entry rule, exit rule, market condition, and execution assumption. Test across multiple coins and periods, then review losing signals as carefully as winners. A MACD crossover may look convincing on one chart and fail repeatedly in choppy conditions.
The strongest workflow is “screen, confirm, define risk, test, review.” GeckoScreener scans 100+ cryptocurrencies for MACD, RSI, EMA, volume, ADX, and price-action conditions in a sortable interface that refreshes every 60 seconds. Visit GeckoScreener to apply the process consistently.
GeckoScreener Team
Written for the GeckoScreener community. Join us on Telegram →
Related Articles



Start screening cryptocurrencies for free
Apply strategies like this one in real-time across 250+ coins.
Try GeckoScreener →