8 Day Trading Crypto Strategies for 2026: Rules & Examples
Explore 8 proven day trading crypto strategies with setup rules, risk parameters, real examples, and chart images for actionable insights in 2026.
GeckoScreener Team
Aug 12, 2026 · 22 min read
Updated about 2 months ago
You're staring at a live crypto table, the chart stack is moving faster than your decisions, and every setup looks urgent. That's exactly the problem in day trading crypto strategies in 2026, the market doesn't reward random entries, it rewards clear filters, tight exits, and the discipline to sit out bad conditions. The backdrop is unforgiving. Multiple 2025 to 2026 sources say roughly 70% to 90% of retail day traders lose money in their first year, while only about 10% to 15% reach consistent profitability, and one source narrows consistent monthly profitability after two years to 3% to 5% (Business Money).
At the same time, crypto day trading has become more systematic. A 2026 analysis reports about 4.2% average daily volatility for the top 10 cryptocurrencies, 45% year-over-year growth in liquidity depth, and 88% of intraday volume attributed to bots, which is why the strongest playbooks now focus on repeatable setups, not gut feel (BYDFi). That makes a screen-first workflow more useful than ever, especially when you're scanning RSI extremes, MACD shifts, Bollinger reversals, and breakout volume in one place.
Table of Contents
- 1. Scalping with RSI Divergence
- 2. Momentum Trading with MACD Crossovers
- 3. Mean Reversion Trading with Bollinger Bands
- 4. Breakout Trading with Volume Confirmation
- 5. Candlestick Pattern Trading Hammer, Doji, Engulfing
- 6. ADX-Filtered Trend Trading ADX > 25
- 7. EMA Crossover Strategy Fast Slow EMA Ribbons
- 8. Support Resistance Level Trading with Volume Profile Analysis
- Day Trading Crypto: 8-Strategy Comparison
- Next Steps to Sharpen Your Edge
1. Scalping with RSI Divergence
Scalping only works when the chart offers a fast edge and the market has enough liquidity to let you exit without friction. RSI divergence matters on short timeframes because it shows the point where price keeps pushing but momentum stops confirming. On crypto pairs, that failure often appears first on a 5-minute or 15-minute chart, where the move is small enough to trade and still large enough to cover fees if the entry is clean.
The filter is straightforward. Look for RSI below 25 or above 75, then check whether volume confirms the move or starts to fade. Tradelize and TradeAlgo both frame short-term crypto trading around tight risk control and fast execution, so RSI should be treated as a trigger for review, not as the trade itself (TradeAlgo). GeckoScreener's real-time filters speed up that review because you can screen the active coins first, then open only the charts that show the right mix of momentum, liquidity, and spread behavior.
A workable scalp is usually a reaction trade. BTC/USDT holding above prior support while RSI sits in oversold territory can justify a quick long if buyers keep defending the level and the candle structure turns higher. ETH/USDT showing bearish RSI divergence near a local peak points the other way, but a short only has a case if price stops expanding and volume cools at the same time.
2026 chart examples on 5-minute and 15-minute views usually reward restraint. A lower-timeframe long after bullish divergence works best when the candle closes back above VWAP, the spread stays tight, and volume rises on the reversal candle. A bearish divergence near intraday resistance is weaker if the pair is printing wide wicks, because that often signals two-sided trade rather than clean exhaustion. GeckoScreener's upcoming backtesting and alert features should make that distinction easier to study, since traders will be able to check which divergence setups held up after the first reaction.
For a cleaner workflow, use these checks before entry:
- RSI Extreme: Screen for assets below 25 or above 75 before you open the chart.
- Volume Confirmation: Prefer setups where volume expands into the turn, not fades away.
- Candlestick Context: A Doji or Spinning Top at the turn matters more than a random candle.
- Risk Control: Keep the stop tight and the target realistic, because a scalp that needs room is no longer a scalp.
2. Momentum Trading with MACD Crossovers
A strong trend can move faster than most traders expect, then keep extending after the first pullback. MACD crossovers fit that kind of action because they help confirm whether momentum is still expanding or already fading. In a crypto session with clean direction, the goal is to join the move while participation is still broad enough to carry it.
GeckoScreener is useful here because it lets traders scan across many pairs instead of opening chart after chart by hand. Its best indicators for crypto trading guide helps place MACD in context, since crossovers carry more weight when price already shows directional pressure and volume is not drying up. That matters because MACD alone can look convincing in a choppy market and still fail quickly. Broad trend tools, momentum tools, and volume should be read together, not as separate approvals.
MACD in a fast market
The cleaner setup is usually straightforward. ETH/USDT on a 1-hour chart can produce a MACD cross above the signal line and continue higher for several hours, while SOL/USDT on a 15-minute chart may turn bearish and drop quickly if the histogram weakens soon after the cross. BTC/USDT can also show early warning signs when MACD starts to diverge from price and momentum begins to fade before the chart turns lower.
Recent intraday practice points in the same direction. The verified framework from BYDFi pairs MACD with ADX > 25 and looks for a 1:3 risk-reward ratio in intraday crypto, which is a more selective approach than reacting to every crossover (BYDFi). That filter matters because a crossover inside a weak or directionless market often reflects noise rather than a trade with follow-through.
A practical MACD workflow usually looks like this:
- Trend Filter: Only take buys when the broader trend already looks constructive, and only take shorts when the structure is clearly rolling over.
- Confirmation Layer: Wait for the MACD cross and a candle close that shows real participation, not just a brief wick through the level.
- Exit Logic: If histogram strength starts contracting, reduce risk or exit rather than hoping for another extension.
- Timeframe Discipline: Use 1-hour charts for held momentum, 15-minute charts for faster intraday movement.
- GeoScreener Scan Logic: Set alerts for pairs with rising volume, directional candles, and a fresh MACD cross so you can focus on the few charts that still justify attention.
The tradeoff is clear. MACD crossovers can keep you aligned with strong trends, but they also lag the first burst of the move. That lag is acceptable when the market is persistent and participation is broad, and it is costly when the pair is already stretched or the cross happens inside a tight range.
3. Mean Reversion Trading with Bollinger Bands
Mean reversion becomes more attractive when price stretches too far and then starts to lose momentum. Bollinger Bands help frame that setup because they plot volatility around a moving average, while the outer bands mark areas where price has moved far from its recent center. A touch of the upper band still does not guarantee a reversal, but it does show the market may be extended relative to its recent pace.
Context matters more than the band itself. A fade setup is stronger when price reaches the upper band inside a range, while the same touch during a strong trend often reflects continuation pressure rather than exhaustion. The broader rule is simple. Use the band as a volatility cue, then ask whether the market has already committed to direction or is still rotating around value.
A 2026 chart reading makes that distinction easier to see. On BTC/USDT, a sideways session with repeated rejections near the upper band can offer a cleaner short back toward the middle band than a breakout attempt. On ADA or XRP, the same pattern often appears after volatility contracts and price begins to oscillate around a central average instead of trending with conviction. That is also where Bollinger Bands settings for GeckoScreener become useful, because the right band width and lookback help separate a normal expansion from a move that is already overextended.
Trade quality improves when the setup is filtered instead of traded mechanically.
Bollinger squeezes deserve attention because they often precede expansion. Tight bands do not promise the next move, but they do signal that the market has been quiet enough for a stronger impulse to develop once participation returns. The best mean reversion trades usually appear before that expansion starts, while volume is still muted and price has not fully committed to a trend. Once volume expands and candles start closing outside the range with conviction, the edge shifts away from fading and toward respecting the move.
A practical rule set looks like this:
- Range Confirmation: Favor setups when volume stays subdued and price keeps returning toward the same average.
- Entry Discipline: Fade the edge of the range, not the middle.
- Exit Target: The middle band is usually the first objective.
- Risk Control: Trend days can invalidate the setup quickly, so stops need to stay tight.
- GeckoScreener Filters: Focus on pairs with compressed candles, narrowing band width, and repeated rejections near the outer bands so you are not fading every random spike.
The limitation is clear. Mean reversion works best when the market is rotating, but it can fail fast when a trend reasserts itself after compression. That makes it a selective strategy, not a default one.
4. Breakout Trading with Volume Confirmation
Breakout trading works only when the market accepts the new price level. A clean move above resistance on weak participation often fails because the breakout lacks follow-through, and price returns to the prior range. The stronger setup appears when the candle closes outside the range and volume expands enough to show that buyers or sellers are committed.
A practical intraday framework keeps the rules tight. For breakout setups, one guide recommends a 15-minute or 1-hour candle close beyond the range backed by at least 1.5x average volume. Another guide suggests placing stops below the pullback low on continuation trades, often about 0.5% to 1.0% below entry, taking a partial profit at the prior swing high, and aiming for roughly 2x the initial stop distance on the remaining position. That structure reduces the odds of treating every brief poke through resistance as a valid trade.
GeckoScreener is most useful here when it is set to look for compression followed by expansion. A pair like BTC/USDT can sit in a tight band for hours, then break upward on a visible volume surge. SOL/USDT can offer the same type of setup on the downside if the candle closes decisively and the move is not just a stop sweep inside a thin market. The filter logic is straightforward, compressed price action first, then a volume jump that confirms the move instead of merely testing it.
The image below shows the basic shape of a breakout setup.
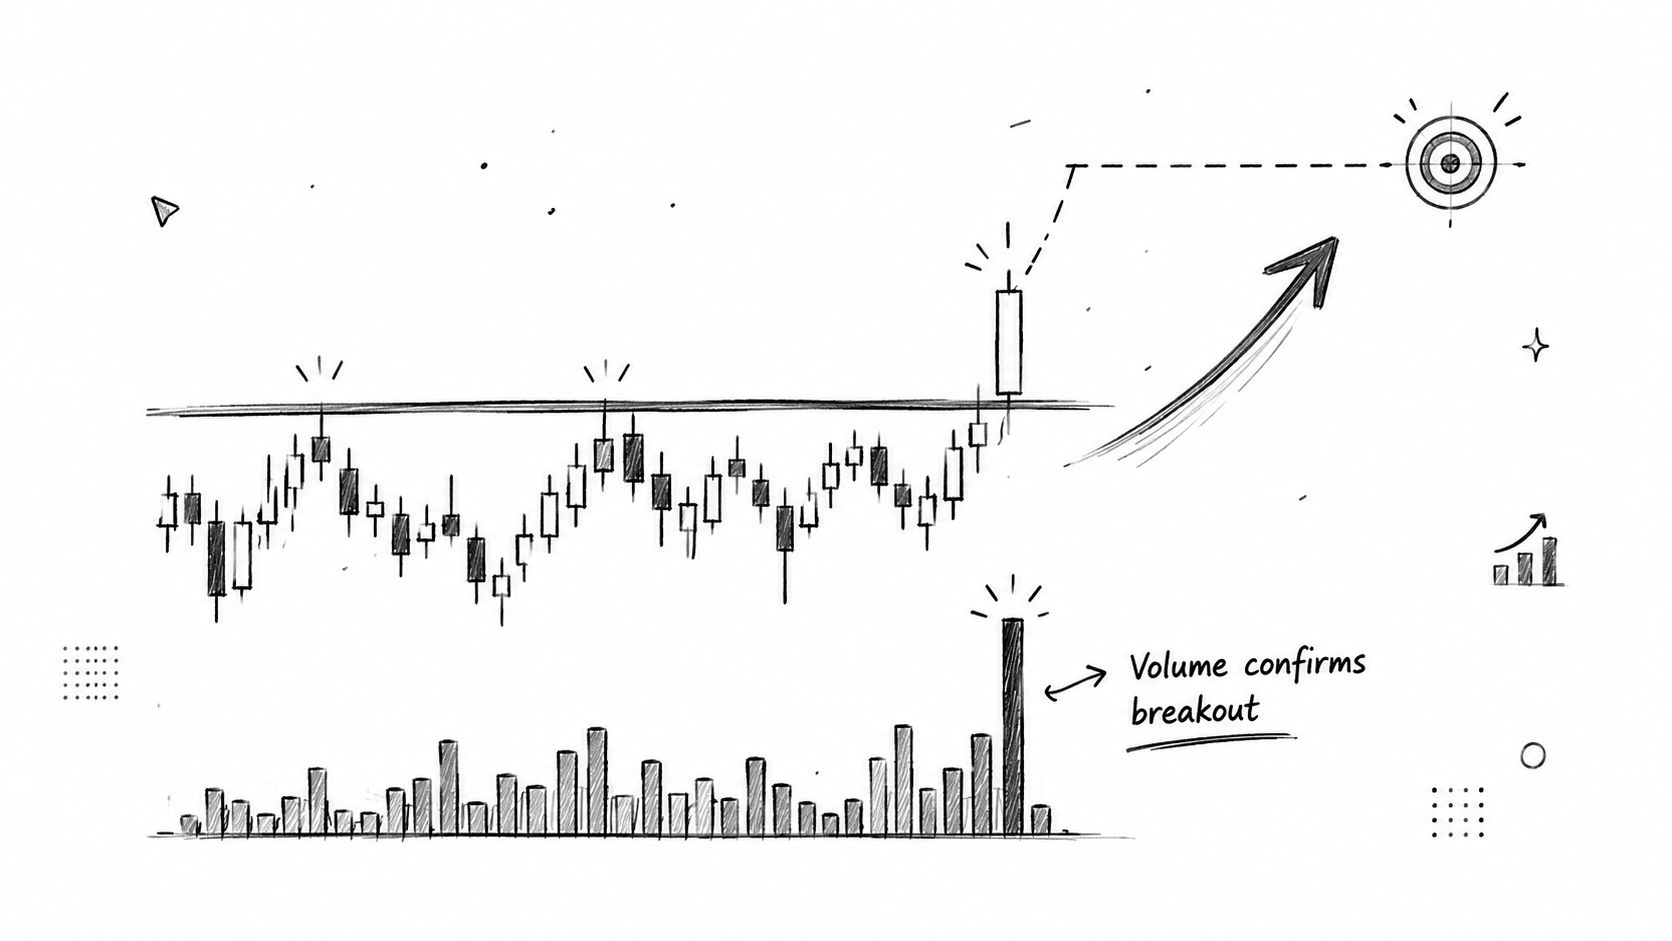
A breakout without a closing candle and without visible volume confirmation is just noise with better marketing.
A sensible breakout workflow is this.
- Compression First: Watch for a narrow range before expecting expansion.
- Volume Second: Require real participation, not a thin move through resistance.
- Entry Third: Enter on the close outside the zone, not on the wick.
- Stop Placement: Put the stop beyond the failed breakout area, not inside it.
Breakout trading also benefits from chart context. A clean 2026 example is a range that contracts, then breaks with a wide candle and expanding turnover while the rest of the market is still muted. That kind of move is easier to separate from a false break when you compare it with a nearby failed attempt on the same chart. The setup becomes more selective, and that is the point. Traders who wait for confirmation can avoid many whipsaws, while traders who chase every early break tend to absorb the cost of failed momentum.
5. Candlestick Pattern Trading Hammer, Doji, Engulfing
A candle pattern by itself is rarely enough in crypto. A Hammer only carries weight if it forms at a level where sellers had already been pressing lower and buyers then rejected that push. A Doji matters most at resistance or support, where it shows that the next move has not been decided. Engulfing patterns are more informative when one side absorbs the prior candle's range and the market is sitting at a visible decision point.
GeckoScreener's candlestick detectors fit that workflow because they can surface pattern candidates without forcing a trader to scan every chart by hand. The product description says the platform supports 19 candlestick pattern detectors, which helps when the watchlist is broad and the market is moving fast. The internal guide on how to read crypto charts aligns with that approach, because pattern trading depends on structure, context, and confirmation, not just the candle name.
Reading the candle at the level
A BTC/USDT Hammer after a decline can support a short bounce if it forms directly at support and closes with a clear wick rejection. ETH/USDT printing a Doji into resistance only matters if the next candle confirms hesitation with directional follow-through. SOL/USDT Bullish Engulfing patterns are stronger when the prior candle's body is fully absorbed and volume expands as the reversal starts to form.
The cleanest trades are usually the most restrained ones. The pattern appears at a level that has already proven relevant, volume supports the reaction, and the next candle does not contradict the signal. That same discipline is visible in 2026 chart reviews, where pattern quality improves when traders separate isolated candle shapes from candles that form after a clear push into support or resistance. A Hammer in the middle of a choppy range is a weaker setup than the same candle at a well-defined floor.
A practical filter set keeps the pattern work focused:
- Level Confluence: Treat the pattern as meaningful only if it forms at support or resistance.
- Volume Support: Favor candles with visibly stronger volume than the bars before them.
- Trend Context: Use the pattern as continuation in trends, or reversal in ranges.
- Asset Preference: BTC and ETH often produce cleaner signals than thin low-cap names.
GeckoScreener is also positioned to make pattern trading easier to audit later, since the upcoming backtesting and alert features should let traders check which candle setups held up and which ones failed. That matters because candle patterns are easy to spot after the fact, but much harder to trade well without rules. A scanner can surface the setup, and a backtest can show whether the pattern had real edge in the market you were trading.
6. ADX-Filtered Trend Trading ADX > 25
A strong crypto move can look tradable long before it is worth following. ADX helps separate those moments. It does not point to direction on its own, but it does measure whether a market has enough trend strength to justify directional trades, which makes it a filter before it becomes part of an entry.
A 2026 review found that ADX > 25 aligns with strong trending conditions, while ADX < 20 points to range-bound price action, and it recommends using ADX to screen trades before taking a directional position (BYDFi). The same review links trend trades to a 1:3 risk-reward ratio, which is a reminder that filtered setups only work when the move has room to extend. TradeAlgo also notes that ADX slope matters, because a rising ADX usually signals strengthening trend pressure, while a falling ADX can be a warning that momentum is fading (TradeAlgo).
BTC/USDT moving from ADX 18 to 26 is a clean example. The shift does not guarantee upside, but it does tell traders that trend-following setups become more credible once strength improves. ETH/USDT with a high ADX reading and supportive directional movement gives a better case for holding momentum trades instead of fading every push. SOL/USDT often shows the opposite problem, where ADX rolls over and directional lines start to work against the position before the trade has finished playing out.
Rule of thumb: weak ADX means the chart is still in decision mode, so waiting is usually better than forcing a trend trade.
That filter becomes more useful when it is paired with structure rather than used alone.
- ADX Threshold: Only treat trend setups as valid when ADX is above the cutoff you trust.
- Directional Confirmation: Combine ADX with MACD, EMA structure, or price action before entering.
- Slope Check: A rising ADX supports continuation, while a falling ADX can mark exhaustion.
- Capital Allocation: Put more size into strong-trend pairs and scale back on names that keep chopping.
7. EMA Crossover Strategy Fast Slow EMA Ribbons
A fast EMA crossing above a slow EMA often shows up first when a trend is shifting from hesitation to direction. On crypto charts, that can happen quickly, so the signal matters most when price is already moving with volume and clean structure. Multi-EMA ribbons add another layer, because they show whether the market is stacked in one direction or still crossing back and forth.
GeckoScreener's publisher description says the platform refreshes data every 60 seconds, which makes it practical for watching crossover setups without waiting on stale charts. Its table-based workflow also suits traders who need to scan a large list of coins and filter for pairs where the short EMA has already started to separate from the longer ones. A clean crossover on its own is only a starting point. A stacked ribbon gives the move more context, especially when the chart is already showing trend strength on the higher time frame.
BTC/USDT on a 15-minute chart can show the 5-EMA crossing above the 20-EMA, then both lines moving above the 50-EMA. That setup is stronger than a single cross because the ribbon is aligned instead of just reacting to one candle. ETH/USDT can hold the 5, 10, 20, and 50 EMAs in order and still offer pullbacks into the fast line, which gives traders a defined area to work with instead of chasing strength. SOL/USDT often shows the opposite problem, where the ribbon tightens, then price slips back through the fast averages and momentum traders keep holding after the move has already lost shape.
The cleanest use of EMA crossovers comes from waiting for confirmation and treating the ribbon as a trend map, not a prediction tool.
- Crossover Timing: Focus on the first few candles after the cross, since later entries often pay worse prices.
- Ribbon Alignment: Favor stacked EMAs over isolated crosses, because alignment shows broader trend agreement.
- Trend Filter: Pair EMA structure with ADX so you avoid acting on weak, noisy crosses.
- Exit Awareness: If the ribbon starts compressing, the trend is losing force and the trade needs closer attention.
8. Support Resistance Level Trading with Volume Profile Analysis
A clean support or resistance line can look convincing on its own, but volume profile shows whether the market accepted that level. A zone with heavy past trading usually matters more than a line drawn from a few swing highs or lows, because it reflects where buyers and sellers already agreed on price. High-volume nodes often act like stronger barriers, while thin areas can fail faster once price moves back into them.
This strategy rewards patience and selective entries. If price is sitting on a major volume node and starts to hold, a bounce can be tradable. If price pushes into resistance with weak participation and then rejects, the short side often has the cleaner structure. Earlier guidance from TradeAlgo emphasized structural stops, partial profit-taking, and clear invalidation, and those rules matter even more here because level trades fail quickly when the market does not react cleanly. The broader day-trading context also matters, since poor level selection is usually exposed fast in crypto. Business Money makes the same point from a performance angle, strong execution depends on process, not on hoping a level will hold.
2026 chart screens make the difference easy to see. BTC/USDT on a 15-minute chart can retest a historical high-volume node, hold above it, and then expand higher if volume picks up on the bounce. ETH/USDT can fail at a clear point of control and offer a short only if it loses the level instead of reclaiming it. SOL/USDT can break through resistance with expanded participation and keep moving because the level is no longer attracting the same amount of supply. GeckoScreener is useful here because traders can narrow the scan to liquid pairs, highlight reaction zones, and watch for price returning to high-volume areas rather than chasing random candles. Its planned backtesting and alert tools should make this setup easier to test and monitor once they launch.
The best level-based trades usually share the same structure:
- Multi-Timeframe Confluence: Check whether the same support or resistance zone matters on more than one timeframe.
- Volume Profile Priority: Give more weight to nodes where price spent real time and traded heavily.
- Reaction Quality: The first bounce or rejection usually carries more information than later attempts.
- Stop Placement: Place stops just beyond the structural level so ordinary noise does not cut the trade short.
Day Trading Crypto: 8-Strategy Comparison
| Strategy | Implementation Complexity 🔄 | Resource Requirements ⚡ | Expected Outcomes 📊 | Ideal Use Cases 💡 | Key Advantages ⭐ |
|---|---|---|---|---|---|
| Scalping with RSI Divergence | High, rapid decisions, tight rules, fast execution | Very high, constant monitoring, low-latency execution, frequent fees | Small per-trade gains (0.5–2%), high trade frequency, compounding potential | High-liquidity pairs on 5–15min charts, intraday scalpers | ⭐⭐⭐, Fast capital turnover, clear entry signals, multi-asset scalability |
| Momentum Trading with MACD Crossovers | Moderate, rule-based but needs multi-timeframe confirmation | Moderate, real-time screener, 15m–4h charts, occasional active management | Medium gains per move (5–10%+), captures sustained trends, lagging entry | Trending markets, 1–24h swing trades, momentum continuations | ⭐⭐⭐⭐, Objective signals, catches larger moves, pairs well with ADX |
| Mean Reversion with Bollinger Bands | Moderate, requires range identification and stop discipline | Low–Moderate, volatility filters, volume checks, periodic monitoring | Frequent small–medium wins (1–3%), high win rate in ranges, poor in strong trends | Ranging/consolidation phases, 15m–1h timeframes, Bollinger squeezes | ⭐⭐⭐, High win rate in ranges, clear band-based entries/exits |
| Breakout Trading with Volume Confirmation | Moderate–High, pattern recognition, patience for setups | Moderate, volume analytics, real-time alerts, readiness to enter fast | Potential large gains (8–25%) if sustained; risk of failed breakouts | Consolidation breakouts, liquid pairs, multi-timeframe confirmation | ⭐⭐⭐⭐, Early access to big moves, volume filter reduces false breakouts |
| Candlestick Pattern Trading (Hammer/Doji/Engulfing) | Low–Moderate, pattern detection easy, needs confluence filters | Low, pattern scanner, volume/support checks, manageable monitoring | Variable (1–5%), depends on pattern & confirmation; many signals available | Reversal/continuation at support/resistance on 15m–1h charts | ⭐⭐⭐, Universal, easy to learn, automated detection improves speed |
| ADX-Filtered Trend Trading (ADX > 25) | Moderate, disciplined filter use, combine with direction indicators | Low–Moderate, ADX screener, confirmation indicators, selective trading | Higher-probability trades, fewer whipsaws, improved risk-reward | Strong trending environments, 1h–4h swing/day trades | ⭐⭐⭐⭐, Objective trend filtering, reduces false signals and noise |
| EMA Crossover Strategy (Fast/Slow Ribbons) | Low–Moderate, simple crossover rules but prone to whipsaws | Low, EMA ribbon tools, regular checks, easy automation | Moderate trend gains, later entries than leading indicators | Intraday trend-following (5m–1h), visual ribbon confirmation | ⭐⭐⭐, Simple, visual, easy to automate and combine with ADX |
| Support/Resistance + Volume Profile | High, multi-timeframe level analysis and profile interpretation | Moderate–High, volume-profile tools, historic data, patient setup | High win rate on bounces (70–80%), favorable R:R, occasional false breaks | Key level trades, institutional zones, all timeframes (scalp→swing) | ⭐⭐⭐⭐, Clear levels, strong R:R, identifies institutional POC for edge |
Next Steps to Sharpen Your Edge
Start with the setups that match the market you're trading, not the one you wish existed. If the chart is trending, focus on MACD crossovers, ADX-filtered trend trades, and EMA ribbons. If the chart is ranging, lean on Bollinger reversion, RSI divergence, and support or resistance reactions with volume confirmation. That's the practical lesson behind the data, most crypto day traders don't fail because they lack ideas, they fail because they treat every setup as if it belongs in every regime (Business Money, Obside).
A screen-first workflow helps you act like a planner instead of a chaser. GeckoScreener consolidates real-time screening, candlestick pattern detection, and strategy validation in one interface, which is useful when you're comparing BTC, ETH, SOL, ADA, and XRP behavior across the same session. Its product description also says backtesting can run across up to nine months and that the platform supports portfolio-mode and per-coin evaluations, which is exactly the kind of comparison that helps traders discover whether a setup behaves well across majors or only on a single pair.
The next edge comes from process, not prediction. Build a small set of rules, keep your risk per trade tight, and track when you should not trade, especially during weak trends and thin liquidity. When backtesting and alerts go live, use them to separate setups that look good from setups that repeat.
If you want a faster way to scan RSI extremes, MACD crossovers, ADX strength, EMA structure, and candlestick patterns in one place, GeckoScreener gives you the table, filters, and strategy workflow to do it. Use it to compare real intraday crypto setups now, then plug in backtesting and alerts as soon as they launch so you can validate what works before risking more capital.
GeckoScreener Team
Written for the GeckoScreener community. Join us on Telegram →
Related Articles


Start screening cryptocurrencies for free
Apply strategies like this one in real-time across 250+ coins.
Try GeckoScreener →