OHM Crypto Price: Live Quote, Chart, and Market Context
Track the OHM crypto price with a live quote, short-term chart, key on-chain metrics, and quick links to deeper analysis of Olympus (OHM).
GeckoScreener Team
Aug 7, 2026 · 13 min read
Updated about 2 months ago
OHM is trading around $15.83 to $16.99 across major venues in 2026, and CoinGecko's 7-day band sits at $15.50 to $17.40. That spread matters more than any single print, because OHM's market is thin enough that the quote you see can move with venue mix and order flow, not just with broad sentiment.
Table of Contents
- Current OHM Price Across Major Sources
- Short-Term Chart Structure and Recent Price Action
- What OHM Is and Why Its Price Mechanism Differs
- Daily Technical Indicators and What They Signal
- Why OHM Prices Differ Across Venues and How to Read the Spread
- OHM Price History and the Shape of the Long-Term Move
- Backtesting and Risk Controls on a Non-Linear Asset
- Why OHM Should Be Analyzed as a Mechanism-Driven Asset
- OHM Quick Reference Summary
- Frequently Asked Questions About the OHM Crypto Price
Current OHM Price Across Major Sources
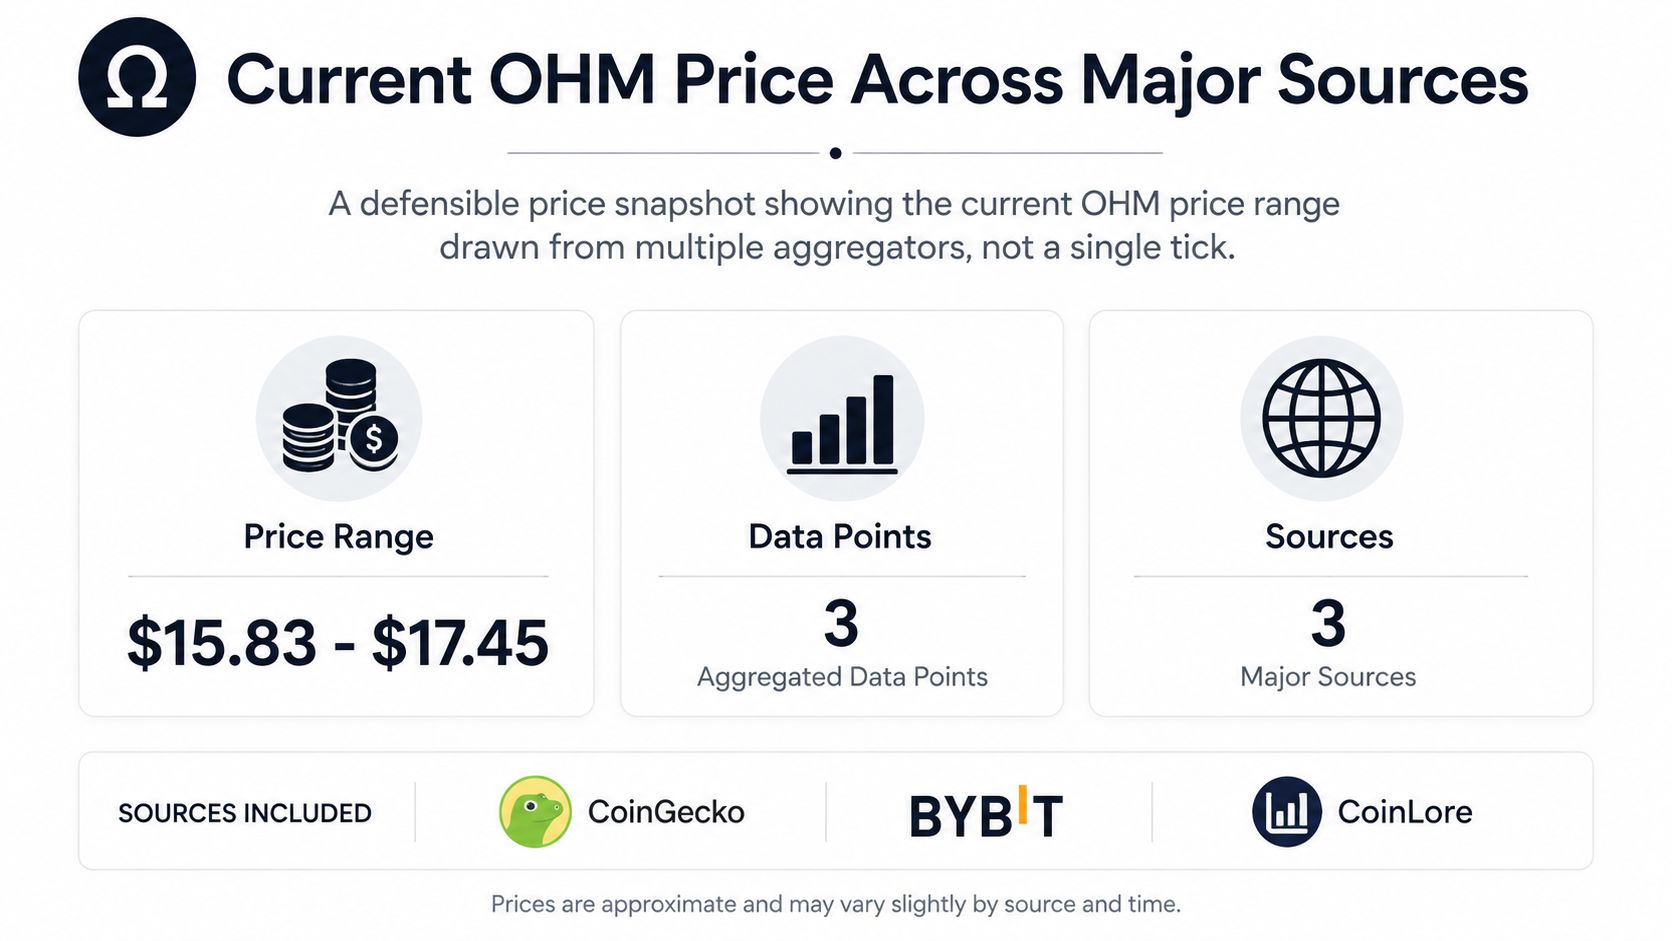
The usable OHM crypto price is a range, not a single print. Major aggregators and exchange screens place OHM around $15.83 to $16.99, while CoinGecko shows a 7-day range of $15.50 to $17.40 and about $154,952 in 24-hour volume. That spread is a warning sign for thin liquidity, because small order flow can move the quote more than traders expect (CoinGecko OHM data).
A quoted price is only as good as the venue behind it. On a market with limited depth, one screen can print a level that looks precise and still be hard to execute at size. The better read is to treat OHM as a banded market, then compare at least two sources before using any single number for execution.
Practical rule: use the lower and upper prints as your working bracket, not the cleanest headline tick.
The spread between venues is the signal to watch, not the prettiest chart. A live quote in the middle of the recent band usually carries more practical value than a venue-specific tick that looks exact but may not hold once size hits the book. For a broader screening framework, the OHM price and screening discussion on GeckoScreener shows how to read quote dispersion without mistaking one venue's print for the market.
Short-Term Chart Structure and Recent Price Action
OHM's short-term tape still looks confined to a narrow corridor. The current band near $15.83 to $16.99 sits inside the broader $15.50 to $17.40 seven-day range already observed earlier, which means the market is still trading inside a defined zone instead of forcing a clean directional break.
What the visible structure says
The useful question is not whether OHM is green or red on one screen. The question is where the live candles sit inside the range, because a quote near the middle usually gives less directional edge than a move that presses into one side of the band. That distinction matters more on a thin market, where a single print can look decisive without reflecting durable demand or supply.
Reading rule: a quote in the middle of the band is information, not a signal.
Recent swings also deserve a structure-first read. If the candles are compressing, the market is showing hesitation and a move is more likely to follow once one side absorbs enough orders. If the swings are expanding, execution is becoming more one-sided and the range is being tested with more force. That is why chart readers should map candles to structure, not react to isolated ticks, using a framework like the crypto chart guide from GeckoScreener.
What OHM Is and Why Its Price Mechanism Differs
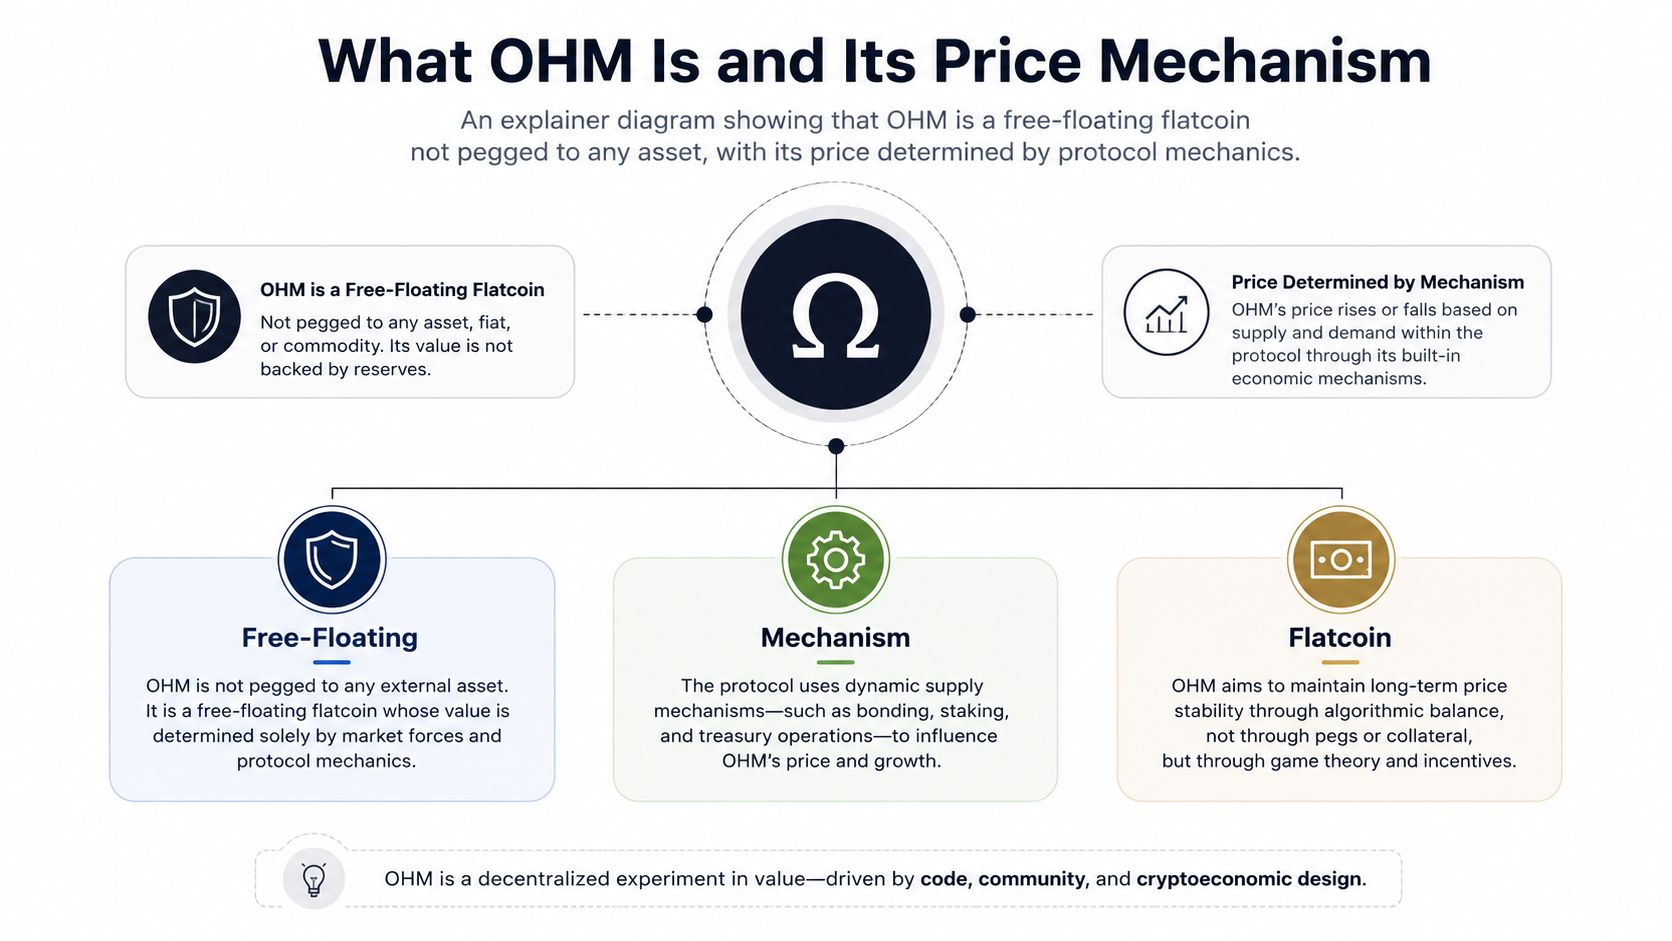
OHM is not a standard fiat-pegged token. IQ.wiki describes it as a free-floating flatcoin that is not tied to a fiat currency and uses the Range Bound Stability (RBS) system to maintain a transparent and programmatically enforced price range (IQ.wiki OHM overview).
Why that changes the price conversation
That difference changes how the market should be read. A stablecoin is usually judged against a peg, while OHM is designed around a range enforced by protocol mechanics. The point is not to lock the token to one fixed dollar value, but to keep price inside a bounded zone through rules that the protocol can apply automatically. If you analyze OHM only through ordinary supply-and-demand language, you miss the mechanism that is meant to shape the quote in the first place.
The better framework is mechanism first, price second. Check whether the live quote sits inside the intended band, whether that band is under pressure, and whether the market is respecting the protocol's structure or pushing through it. That makes OHM easier to compare with other mechanism-driven assets, while also making clear why a single venue print can be misleading when liquidity is thin.
Daily Technical Indicators and What They Signal
The daily indicator stack is mixed to weakly bullish, but that does not justify treating every pullback as a buy. CoinLore reports RSI(14) at 59.31, ADX(14) at 89.02, ATR(14) at 12.66, with SMA(10) at 16.06 and EMA(10) at 16.26 sitting near price, while SMA(200) at 18.26 and EMA(200) at 18.24 remain above it (CoinLore indicators).
| Indicator | Value | Reading |
|---|---|---|
| RSI(14) | 59.31 | Momentum exists, but it is not stretched |
| ADX(14) | 89.02 | Trend strength is very high |
| ATR(14) | 12.66 | Recent volatility is meaningful |
| SMA(10) | 16.06 | Short-term price is close to market |
| EMA(10) | 16.26 | Short-term price is close to market |
| SMA(200) | 18.26 | Long-term resistance sits above price |
| EMA(200) | 18.24 | Long-term resistance sits above price |
How to translate that into a trade view
RSI near 60 shows OHM has upward momentum, but it is still below a classic overbought reading. The moving averages matter more here because the short averages are clustered near the current quote, while the long averages still sit overhead. That tells you the market has active demand, yet it has not cleared the longer-term supply zone that would support a cleaner trend shift.
ADX at 89.02 points to a very strong trend reading, but that strength should be read alongside the rest of the stack, not in isolation. A high ADX does not say which direction is safer, only that the market has been moving with force. If price is still below the longer averages, that force can just as easily reflect a stretched move that has not yet reset.
ATR matters because OHM can move far enough in a single session to make tight stops fragile. The volatility reading argues for wider room in sizing and invalidation levels, especially if you are trading around a crossover or a breakout. A reaction trade only makes sense if you are prepared for sharp intraday swings, because the spread between the short averages and the long averages leaves little margin for sloppy entries.
Why OHM Prices Differ Across Venues and How to Read the Spread
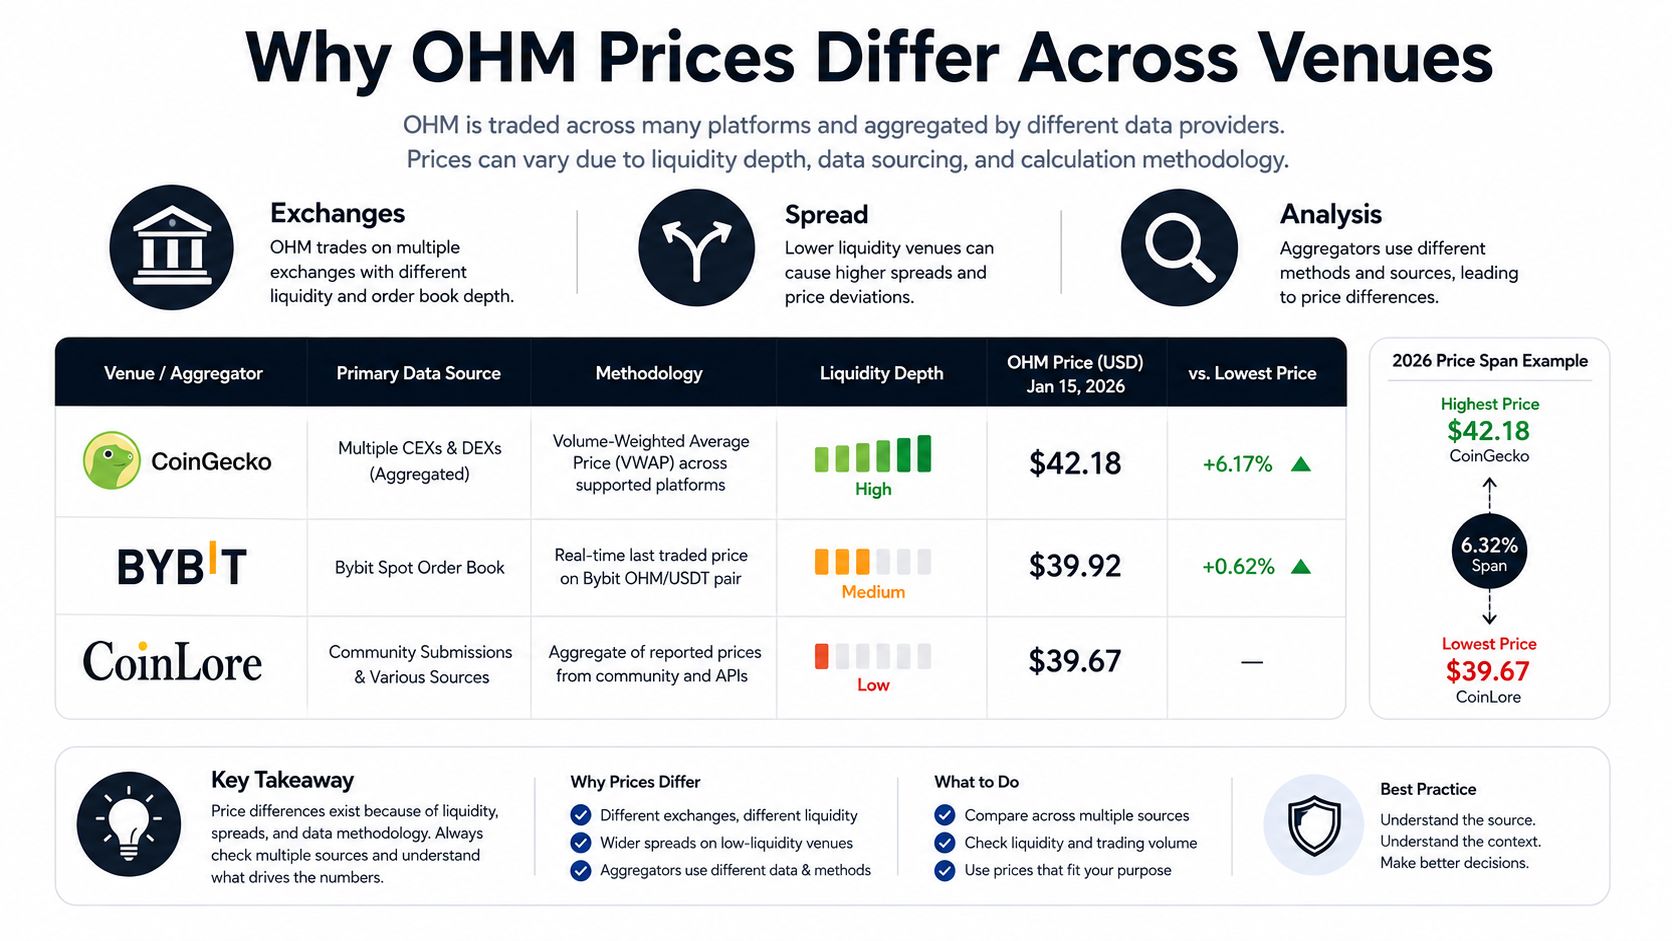
OHM's quoted price differs because different venues don't see the same liquidity, the same order book depth, or the same timing. Bybit and other aggregators show 2026 OHM prices ranging from about $15.83 to $16.99, while a separate source records $22.38 in July 2025 and $22.09 in late 2025, which is exactly what you expect when a thin market is being sampled across different pools of liquidity (Bybit OHM price).
How to choose the quote you trust
The cleanest-looking quote is not always the best execution reference. If a venue has thinner books, the last trade can land far from where size can clear. That's why you should compare at least two aggregators and prefer the source that reflects the market you can execute against.
A single venue print can be useful for reference, but it can also be misleading. The spread itself is the signal, because it tells you the market is fragmented enough that price discovery is still uneven. When you see that kind of dispersion, don't ask which site is “right” first. Ask which one is most likely to fill your order without slippage.
OHM Price History and the Shape of the Long-Term Move
OHM's price history is jagged, and that matters more than any single quote. Early prints around March 2021 started near $1,084, the token reached an all-time high of $1,224 in October 2021, and later traded down to $9.15 in November 2022. That range shows a market that did not just trend, it re-priced repeatedly as liquidity and sentiment changed.
The 2021 boom and the later reset
The first cycle was violent even by crypto standards. One source places OHM's all-time high at $1,415.26 on April 24, 2021, and Kraken's historical table shows the same peak alongside a later daily close of $317.13, which left a -4.58% daily move from the open in that sample. Another market reference puts the all-time high much higher, at $3,209.43 on November 16, 2021, and says OHM is now roughly 99.47% below that level. The gap between those peak prints is part of the story. Different venues captured different extremes, which is what happens when a thin asset is moving fast and prints are uneven.
The yearly profile is just as important as the peaks. OHM's 2021 average price of $743.96, its yearly maximum near $1,315, and its year-end close of $373.50 show a market that spent the year expanding and then giving back a large part of the move. The same source says that year-end close still reflected a 34.45% gain from the open. That mix of a high average, a broad peak, and a lower finish is the signature of a regime shift, not a steady compounding asset.
Backtesting and Risk Controls on a Non-Linear Asset
OHM's range history makes one thing obvious. Fixed-dollar stops and targets are a poor fit. A token that has already moved from the $9.15 area to more than $1,200 on historical prints does not behave like an asset with a stable reference point, so absolute-price assumptions are weak for serious testing.
How to frame risk the right way
Use percentage-based rules for stops, targets, and position sizing. That keeps the model consistent across regimes, which matters when the asset can shift from one market structure to another without much warning. The current ATR(14) of 12.66 supports that view, because volatility is wide enough to make tight fixed offsets unreliable (CoinLore indicators).
Backtesting needs a history-first workflow before capital goes live. A practical starting point is GeckoScreener's backtesting guide, which gives a clear framework for testing rules against prior price behavior. Backtesting and alerts are not live yet in this workflow, so the sensible habit now is to define percentage rules first and be ready to test them once the feature set arrives.
Thin liquidity also changes how risk controls behave in practice. A stop that looks clean on paper can slip hard if execution lands into a narrow book, and that is exactly why OHM should be tested with dispersion in mind, not just a single entry and exit print.
Build the rule in percentages, then test the rule across different price regimes.
Why OHM Should Be Analyzed as a Mechanism-Driven Asset
OHM should be read through its mechanism first and its chart second. A market built around programmatically enforced range behavior does not deserve the same treatment as a token whose price is explained mainly by simple demand and supply. The structure itself is part of the price.
That distinction matters because OHM can reprice when the RBS environment changes, even if the broader market looks calm. For that reason, “range-bound” is the more useful lens than “cheap” or “expensive.” The relevant question is whether the market is holding inside the band, pressing the edges, or drifting away from the structure that defines the token's behavior.
OHM Quick Reference Summary
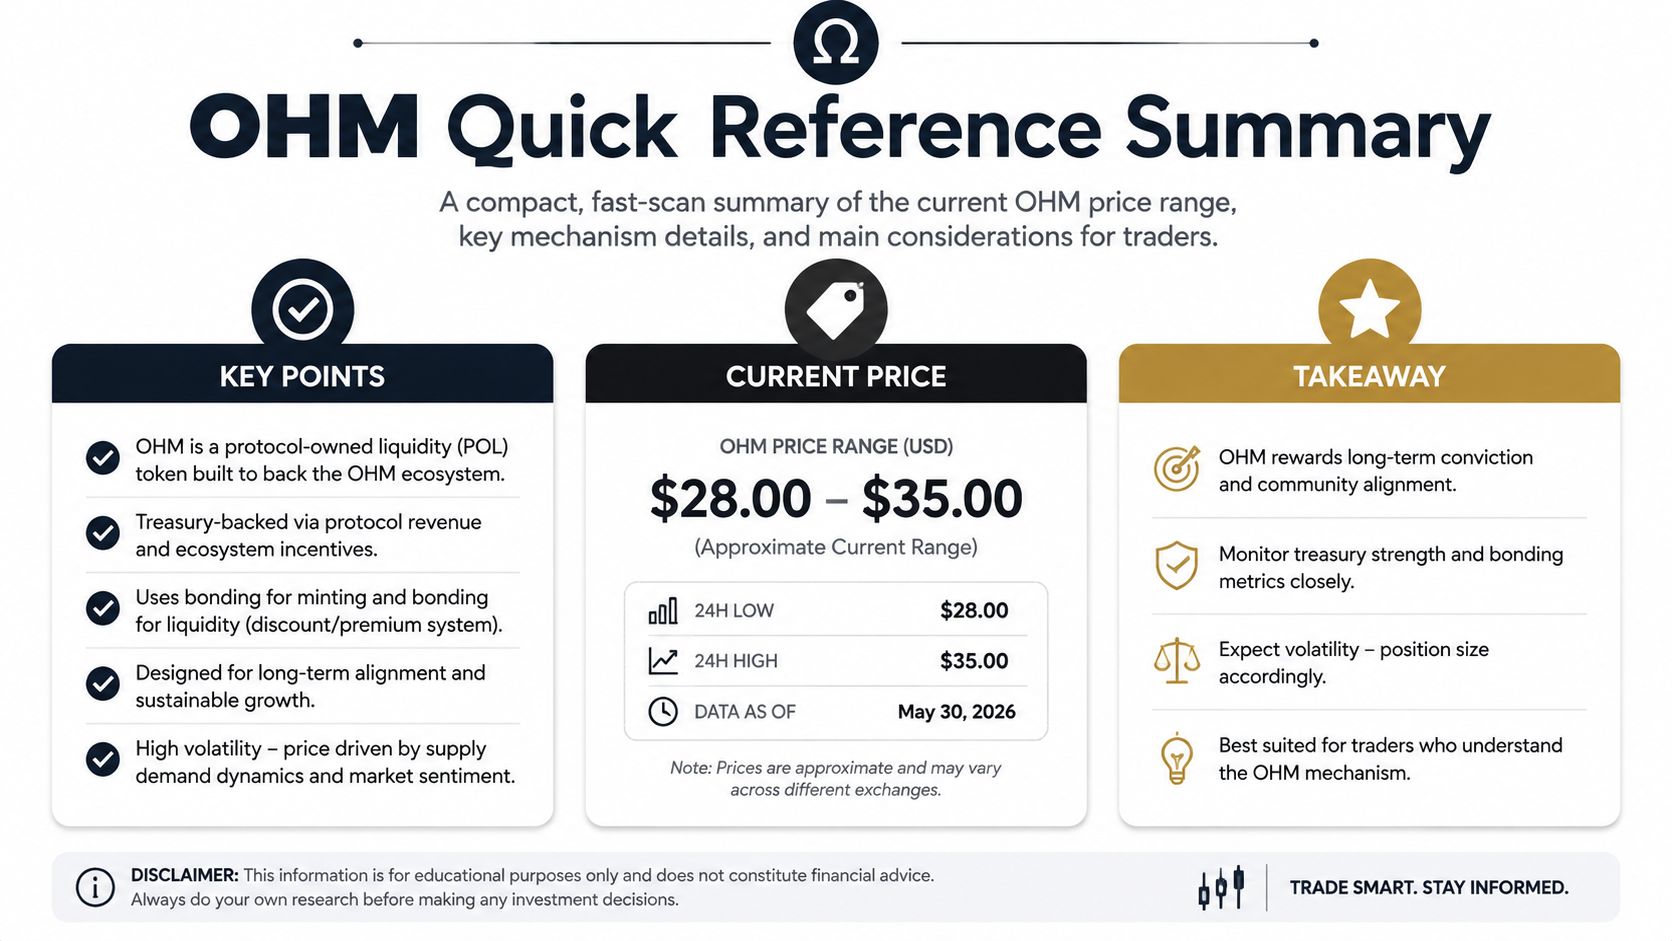
OHM is not trading at a single clean number. Across major venues, the live quote sits around $15.83 to $16.99, while the wider seven-day band has run from $15.50 to $17.40, which is a useful reminder that venue choice and timing change the print you see.
That spread matters because the market is thin. CoinGecko's reported 24-hour volume is about $154,952, so even modest orders can move the execution price away from the headline quote. A single last trade should be treated as a reference point, not as proof of tradable size.
OHM's structure also explains why the number behaves differently from a normal spot token. It is a free-floating flatcoin that uses RBS rather than a fiat peg, so price must be read as part of a mechanism, not just a market snapshot.
Momentum is present, but the setup is not quiet. RSI(14) 59.31 and ADX(14) 89.02 indicate active trend force, while ATR(14) 12.66 shows that OHM can swing far enough to make tight stops and small targets look unrealistic.
The long-term history is even more uneven. The path includes a launch near $1,084, a $1,224 2021 high, and a later $9.15 low, so the asset has already moved through very different regimes. That kind of dispersion makes simple trend lines less useful than regime awareness.
The cleanest summary is straightforward. OHM price should be read as a banded, mechanism-driven market, where venue spread, thin liquidity, and regime shifts matter more than any single quote.
Frequently Asked Questions About the OHM Crypto Price
Why does OHM's price differ by source? Different venues print different numbers because liquidity, order-book depth, and update timing are not the same. A quote on one exchange can be a fair last trade there and still sit outside the range that other venues show.
How reliable is the quoted price for execution? Treat it as a reference band, not a fill guarantee. A last trade can be valid and still offer little help for sizing if the book is shallow, because small orders can move the execution price away from the headline print.
Is OHM pegged to anything? No. It behaves as a free-floating flatcoin that uses RBS to maintain a transparent and programmatically enforced price range, as noted earlier.
What should a trader watch next? Watch the range, the venue spread, and the moving-average stack together. If the quote stays narrow while venue dispersion widens, execution risk is rising even if the headline price looks calm. That is the more useful signal for OHM than any single tick.
Can I use alerts and backtesting right now? The workflow is moving toward those features, and backtesting and alerts will be live very soon. Until then, the safer approach is to document rules in percentages and keep comparing the live range with the venue mix, so your plan is tied to observable price behavior rather than one stale print.
If you want a cleaner way to monitor OHM without relying on a single stale print, use GeckoScreener to screen the market, compare technical conditions, and keep your strategy rules tied to the same kind of range-aware thinking used here. That gives you a better starting point for OHM, especially when liquidity is thin and the quote can shift faster than the headline suggests.
GeckoScreener Team
Written for the GeckoScreener community. Join us on Telegram →
Related Articles


Start screening cryptocurrencies for free
Apply strategies like this one in real-time across 250+ coins.
Try GeckoScreener →