Edge Crypto Price Guide for Traders in 2026
Get a fast reference on edge crypto price with current quotes, history, technical and fundamental notes, plus chart links and cross-venue comparisons.
GeckoScreener Team
Aug 4, 2026 · 11 min read
Updated about 2 months ago
EDGE has traded through a more than 190x price span between trough and peak depending on source and timestamp, and that single fact explains why a one-line quote can mislead traders fast. CoinLore's history shows $0.00988 in May 2020 and $1.47 in March 2025, while CoinGecko's all-time high is $1.52 on March 2, 2025 and its all-time low is $0.007968 on May 1, 2020 (CoinLore historical data, CoinGecko historical data). That gap is the starting point for any Edge crypto price read, because the token's price history, venue context, and ticker identity all shape what traders think they're seeing.
Table of Contents
- Introduction
- Current Edge Crypto Price Snapshot
- Long Term Price History for Edge
- Recent Edge Price Movements
- Fundamental Factors Affecting Edge Price
- Key Technical Indicators for Edge
- Recommended Charts and Trackers
- Comparing Edge Prices Across Venues
- Quick Reference Edge Price Summary
Introduction
The useful way to read Edge crypto price is not to chase a single quote, but to line up the date, the exchange, the quote currency, and the token identity before making any judgment. EDGE has already shown long-run dispersion that is extreme by any practical trading standard, and recent venue snapshots show that the same ticker can print very different values depending on where you look (CoinLore historical data, TradingView EDGEUSDT). That makes this a fast-reference guide for traders who need the current snapshot, the long-term path, the short-term tape, and the technical filters that matter when liquidity is thin. The closing summary is built for quick decisions, with the key risk check front and center.
Current Edge Crypto Price Snapshot
| Source | Price | Market Cap | 24h Volume |
|---|---|---|---|
| CoinGecko | $0.05512 | about $2.25M | $2,253.71 |
| Binance | $0.103353 | Market cap not disclosed | $1,030.03 |
| Bybit | $0.102649 | Market cap not disclosed | $389.20 |
| TradingView | 0.16158 USDT | Market cap not disclosed | $6.46M on one venue snapshot |
| Kraken | Current quote not stated in the verified data | Market cap not disclosed | 107,465,761 EDGE worth $7,645,759 traded in 24 hours |
These quotes show a market that is fragmented rather than unified. The same ticker prints materially different levels across venues, so the first job is identity verification, then timestamp checks, then a comparison of the pair being quoted. CoinGecko's listing pairs a market cap of about $2.25M with only $2,253.71 in 24-hour volume, which points to thin liquidity and a higher risk of slippage when orders hit the book (CoinGecko listing). Kraken's reported 24-hour traded value and Binance's listed volume point to active venue-specific flow that does not line up cleanly with the quieter feed, so a single-source quote can be misleading on its own (Kraken price page, Binance price page).
The practical read is straightforward. EDGE should be checked against the venue, the trading pair, and the local volume before any price reference is treated as tradable.
Long Term Price History for Edge
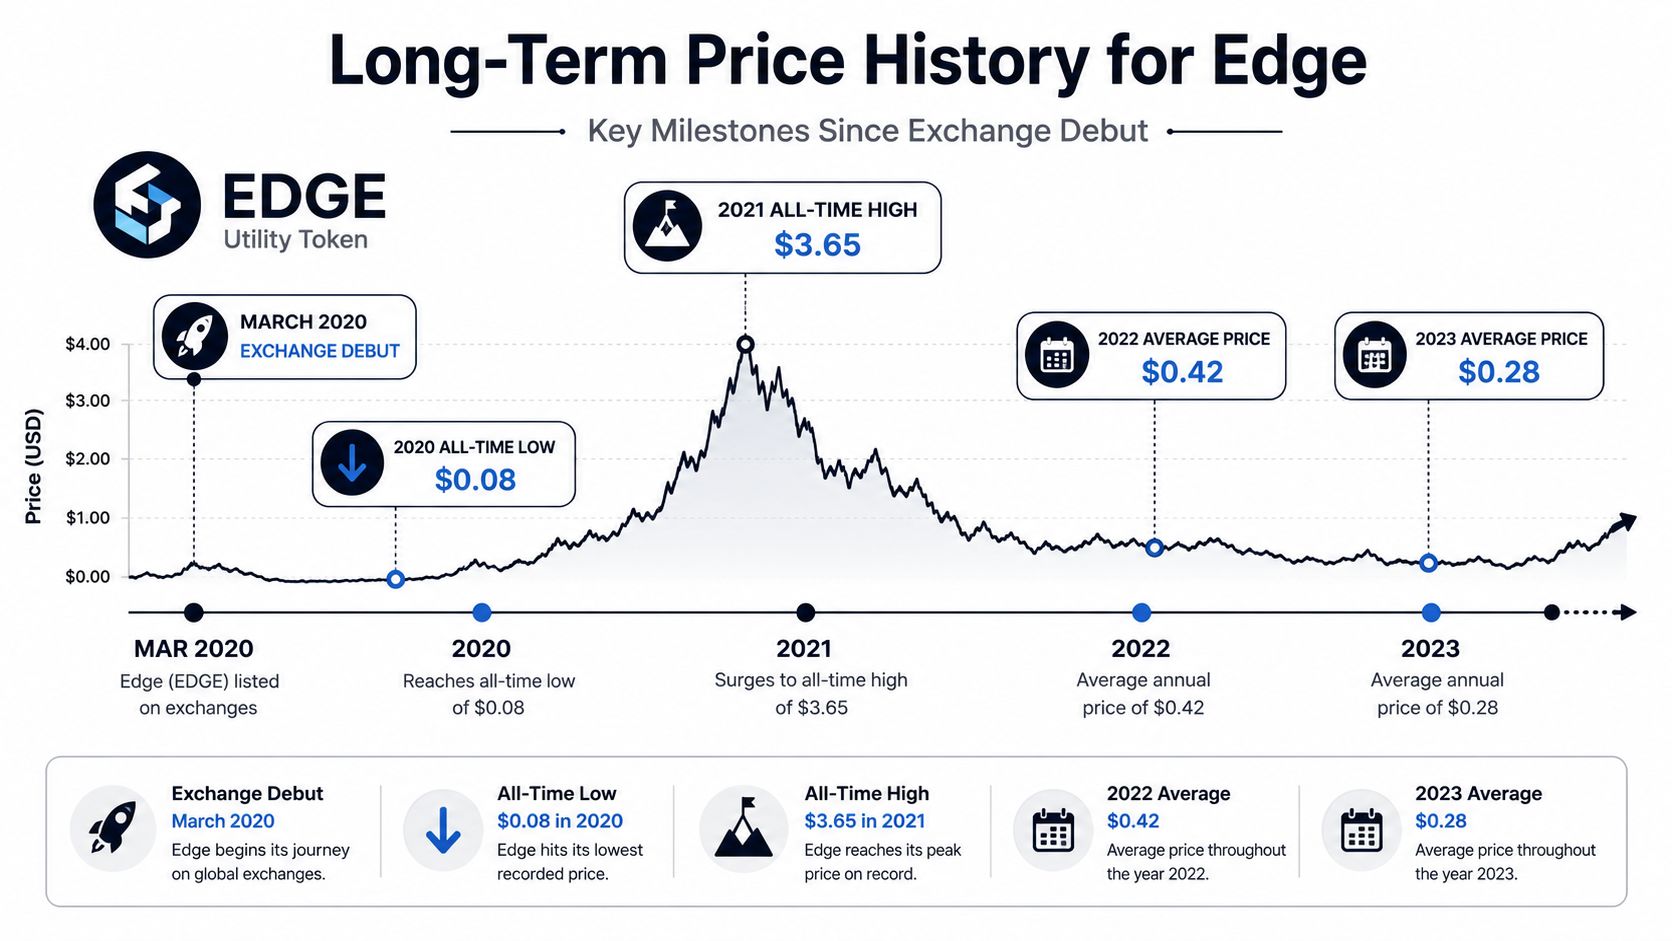
Edge's long-term tape has been shaped by distinct market phases across the cycle. CoinLore shows the token launched in November 2017, first detected an exchange rate of $0.0279 in March 2020, then slipped to $0.00988 in May 2020 before later reaching $1.47 in March 2025 (CoinLore historical data). CoinGecko independently records an all-time high of $1.52 on March 2, 2025 and an all-time low of $0.007968 on May 1, 2020, which places EDGE's history into clearly separate price regimes rather than a single directional move (CoinGecko historical data).
Reading the cycle structure
The annual averages support that reading. CoinLore's history lists average prices of $0.0285 in 2020, $0.0934 in 2022, $0.0798 in 2023, $0.4298 in 2025, and $0.1185 in 2026, with volatility peaking at 2.2 K% in 2025 (CoinLore historical data). Taken together, those figures show a market that has repeatedly moved from quiet trading into sharp repricing, then back into lower-intensity conditions.
That cycle behavior matters for interpretation. Support and resistance drawn from one period can lose relevance in the next, especially if liquidity conditions change with the market phase. A backtest that ignores the date context can mix low-liquidity accumulation zones with later momentum runs, which weakens any read on whether a setup was strong.
When a token has passed through multiple boom-bust cycles, the chart becomes a map of changing market participation.
Recent Edge Price Movements
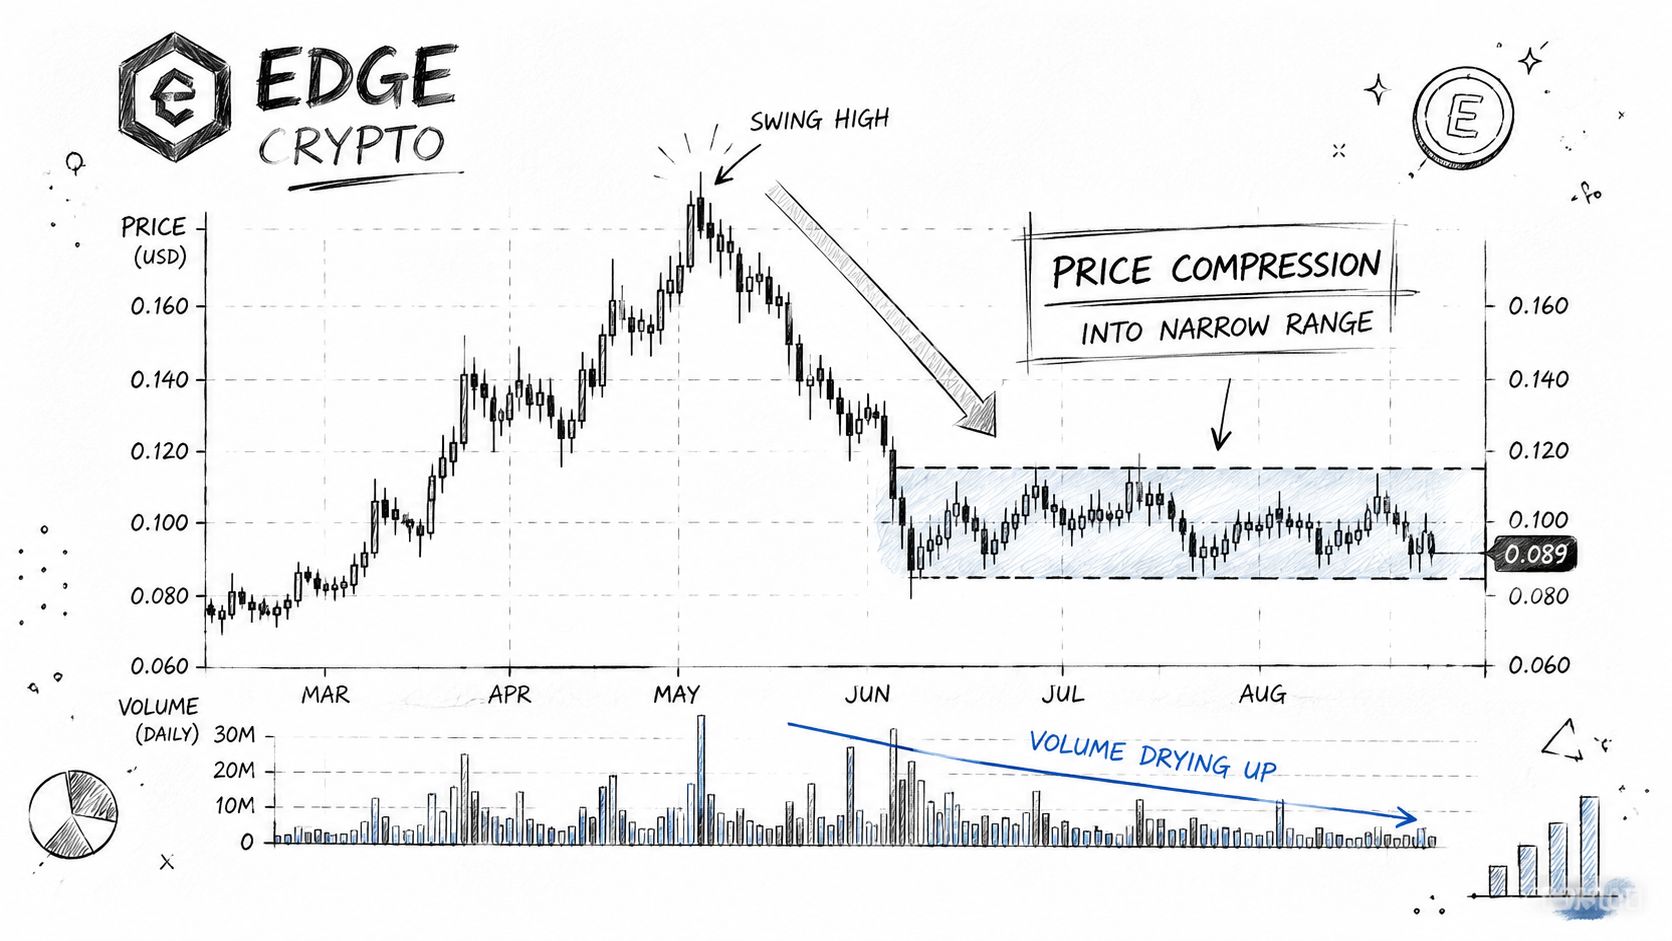
The recent tape shows how EDGE can compress sharply even after large prior swings. CoinGecko records closes of $0.674320 on 2025-06-13, $0.632140 on 2025-06-14, $0.589896 on 2025-06-15, and $0.540178 on 2025-06-16, then shows a market cap of $22,092,983 and $90,060 in volume on 2025-06-17 (CoinGecko historical data). Bitget's history later shows $0.5428 on 2025-07-01 and $0.5842 on 2025-07-02, with daily volumes around $21,243.31 and $19,714.13 respectively (Bitget price history).
What that means for traders
Short windows like this can make technical screens look cleaner than the market really is. A narrow daily range may still sit inside a wider drawdown or recovery phase, so a candle pattern alone does not prove conviction. If you are using RSI, MACD, or moving-average triggers, the recent series argues for waiting on volume follow-through before acting.
The live snapshot also shows a 24-hour range of $0.05326–$0.05706 and states EDGE is 96.4% below its $1.52 all-time high. That gap between short-term range compression and long-run dispersion is exactly why traders should separate short-term momentum from the broader trend.
Fundamental Factors Affecting Edge Price
The biggest non-technical issue is simple, and it's easy to miss. Many aggregators return conflicting prices for EDGE because of ticker overlap with other tokens like Definitive (EDGE) or edgeX, which can create price spreads of 0.055–0.17 USD and very different volumes (CoinMarketCap definitive page). That means a trader who skips contract verification can end up analyzing the wrong asset while thinking the screen is telling a clean story.
Token identity comes first
This is why contract, chain, and exchange listing checks belong before any chart review. If two pages show the same ticker but not the same economics, then any quoted price, volume figure, or backtest result may belong to a different market entirely. The spread across sources is not just a cosmetic issue, it changes whether the market looks liquid, thin, or mispriced.
Liquidity distorts interpretation
Low or fragmented volume can make ordinary setups look stronger than they are. A candle breakout can appear to confirm, then fade immediately if too few participants are trading the same instrument. That's also why a venue comparison belongs in every EDGE price workflow, not just in a disclaimer at the bottom.
Practical rule: verify the exact EDGE listing first, then evaluate the chart, then check whether the printed volume is large enough to trust the move.
Key Technical Indicators for Edge
For EDGE, the most useful indicators are the ones that filter out weak participation, not the ones that merely decorate a chart. 24-hour volume is the first screen, because liquidity determines whether an RSI cross or EMA crossover has any chance of follow-through. A thin market can generate neat signals that fail on execution, while a more active market gives the setup a real chance to hold.
Simple rules that fit the market
A practical no-code screen can start with three filters, a trend condition, a momentum condition, and a liquidity condition. One example is price above a medium-term moving average, RSI rising from oversold territory, and a minimum dollar-volume requirement before any trade is considered. Another is to require a bullish candlestick pattern only when the quote is sitting near a monitored support zone and the spread is tight enough to enter without immediate slippage.
For a broader framework on indicator selection, traders can use the indicator guide from GeckoScreener. The key takeaway is that EDGE behaves like a market where signal quality depends heavily on whether the tape is active enough to confirm the move.
Recommended Charts and Trackers
A reliable EDGE price check starts with venue identity, quote pair, and timeframe on the same screen. If those three items do not line up, a single quote can be misleading fast, especially for an asset that can print different values across markets.
TradingView works well for chart review because it makes cross-venue comparison straightforward, and it is useful for checking whether the EDGE pair you are watching matches the rest of the market. CoinGecko is better for a broad snapshot and historical context, especially if you want a quick read on market size, volume, and ticker identity before you trust a chart.
Binance and Bybit add another layer of context because they show how the same ticker can behave on separate venues. That helps separate a real price move from a venue-specific print. For screening and chart workflows that combine filters with market review, the GeckoScreener market analysis tools guide is a useful reference.
I would keep one charting tab, one aggregation page, and one exchange page open together, then compare them before making a decision. That routine reduces the risk of acting on a quote that does not match the broader market.
Comparing Edge Prices Across Venues
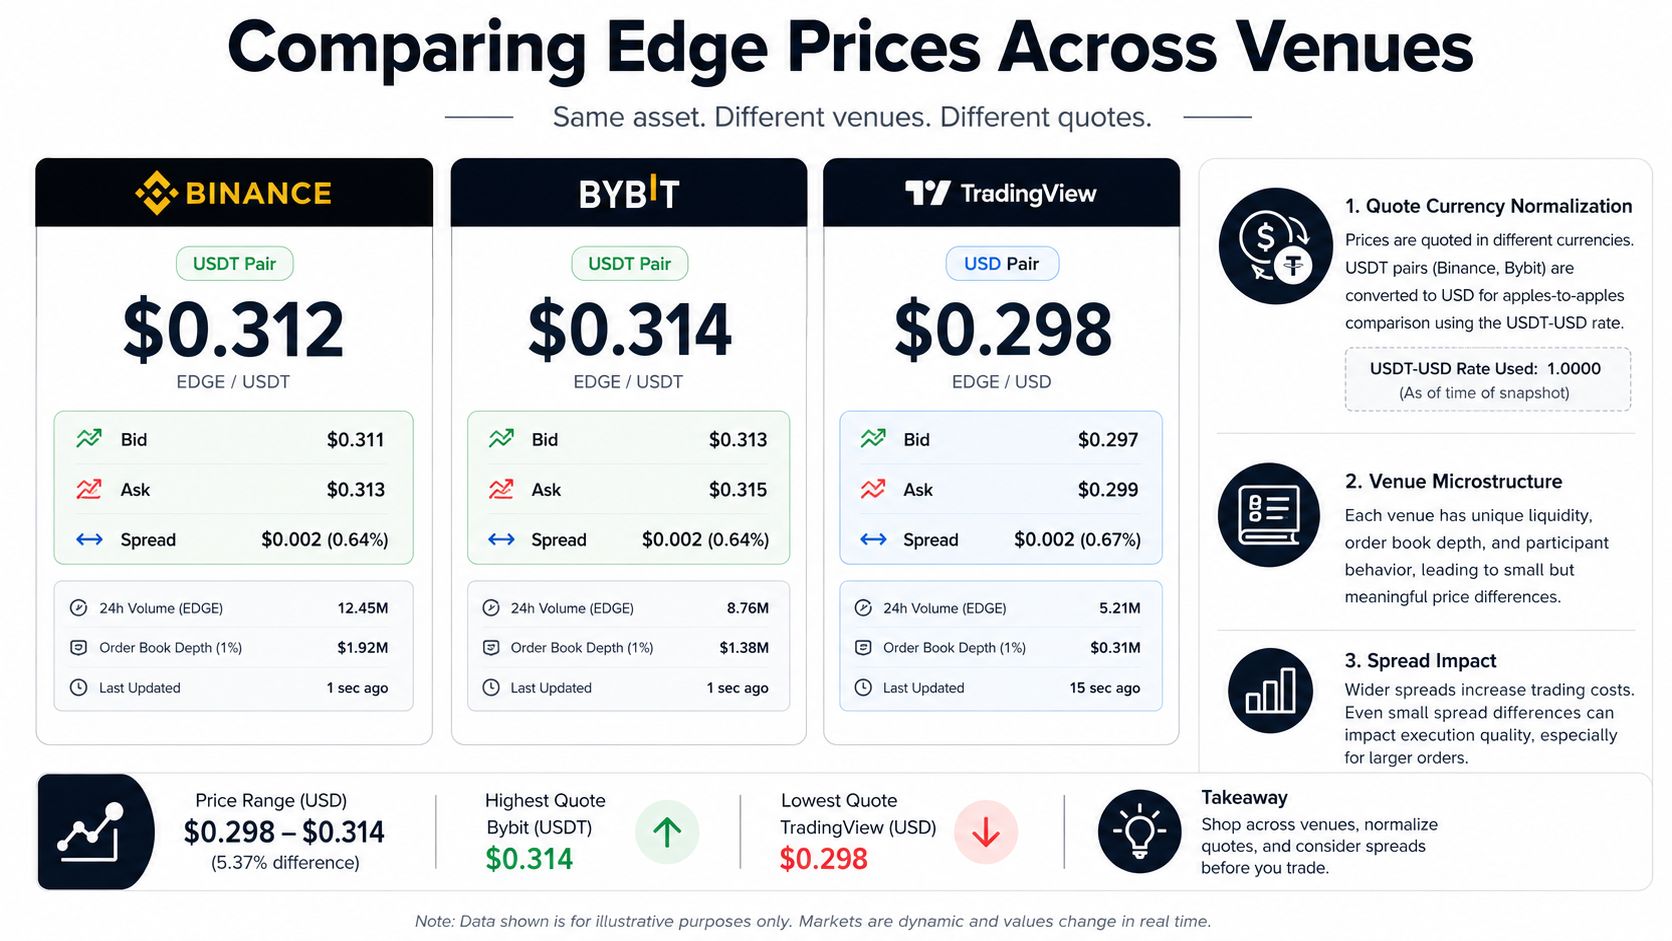
EDGE shows why ticker identity verification should come before any price read. The same name can surface with different quote assets, different liquidity conditions, and different market depth, so a single screen can make the market look more consistent than it really is. That is the main reason cross-venue checks matter before you act on a fast quote.
The spread across venues is wide enough to change interpretation. A quote near 0.16158 USDT on TradingView, a USD read near $0.05512 on CoinGecko, and a Binance listing around $0.103353 do not point to a simple rounding gap. They point to venue differences, pair differences, and likely differences in liquidity or market structure. Reported volume also varies sharply across snapshots, which means the price print alone does not tell the full story. In practice, the key question is whether you are looking at the same token, the same quote currency, and a liquid market that can absorb size. If those three pieces do not match, the comparison is weak by design.
Why the spread exists
Venue microstructure explains most of the gap. Different exchanges, different pairs, and different pools can each produce a separate print, so comparing them without normalizing the quote asset creates a false sense of precision. A market with uneven liquidity can also move faster on one venue than another, which makes the quieter book look more volatile even when the broader token is not changing that quickly.
Price checks should be paired with execution context, not treated as standalone signals. The best crypto trading platforms guide is a useful reference if you want to compare screening, charting, and venue selection side by side. The practical rule is simple, verify the contract, confirm the quote pair, and check liquidity before trusting any EDGE price read.
Quick Reference Edge Price Summary
Current read: EDGE pricing is split across venues, with quotes around $0.05512, $0.103353, $0.102649, and 0.16158 USDT depending on source and pair. Trend: recent closes showed a short decline, while the longer history still shows repeated boom-bust cycles. Volume filter: require meaningful dollar volume before trusting RSI or candlestick triggers. Key check: confirm the correct EDGE contract and venue first, or the price read can be wrong from the start.
The main takeaway is that a single quote can mislead if the token, the pair, or the venue is not the same. Cross-venue spread matters because it can reflect real differences in liquidity and execution quality, not just noisy rounding. A quick ticker check is the safest first step before using any EDGE price for a trade decision.
GeckoScreener gives traders a way to screen crypto markets, compare indicator conditions, and test rules before risking capital. If you're tracking Edge crypto price, it is useful for checking whether a setup is supported by volume, trend, and pattern data on the same screen. Visit GeckoScreener to compare live price action and build a cleaner workflow around the markets you want to trade.
GeckoScreener Team
Written for the GeckoScreener community. Join us on Telegram →
Related Articles
Start screening cryptocurrencies for free
Apply strategies like this one in real-time across 250+ coins.
Try GeckoScreener →