What Is a Bull Flag in Trading and How to Trade It
What is a bull flag in trading? Learn how the flagpole, flag and breakout work with volume rules, crypto examples and chart images.
GeckoScreener Team
Aug 15, 2026 · 15 min read
Updated about 2 months ago
You're watching a crypto asset surge, then the candles suddenly lose their urgency. Price stops climbing, volume fades, and the chart drifts sideways or slightly lower. The obvious question is whether buyers are preparing the next move or whether the rally has already run out of energy.
That pause may form a bull flag, a continuation pattern that traders use to study whether an existing uptrend could resume. It isn't a magic signal or a promise of higher prices. The useful question is not just, “Does this chart look like a flag?” It's whether the preceding move was strong, the consolidation remains controlled, volume behaves as expected, and the eventual breakout attracts real demand.
If you're still building your chart-reading foundation, this guide to reading crypto charts can help with the broader skills behind pattern analysis. By the end of this article, you'll be able to identify the pole, inspect the flag, evaluate volume, plan a measured move, define invalidation, and judge why timeframe and pattern quality can change the outcome.
Table of Contents
- Introduction to the Bull Flag Pattern
- What a Bull Flag Really Is and Why It Forms
- Anatomy of a Valid Bull Flag and How to Spot It
- How to Trade a Bull Flag Breakout With Rules and Risk Control
- Bull Flag Chart Examples You Can Learn to Recognize
- How Reliable Is the Bull Flag and When It Fails
- Key Takeaways and Next Steps for Crypto Traders
Introduction to the Bull Flag Pattern
A bull flag usually appears after a sharp advance. Early buyers may take profits, while traders who missed the initial rally wait for a more controlled entry. Price then pauses in a relatively narrow area instead of immediately collapsing. If buyers return and price breaks above the flag's upper boundary, the pattern is treated as a possible continuation setup.
The visual analogy is simple. The strong rally is the flagpole. The short consolidation is the flag. The move above the flag is the potential continuation.
That description sounds straightforward, but crypto charts make the distinction harder. A fast market can produce a clean-looking pause that's distribution, random sideways noise, or a temporary bounce inside a larger downtrend. A wick above resistance can also lure traders into an entry before price falls back into the range.
A bull flag is a probability framework, not a prediction machine.
The pattern matters because it gives you a structured way to ask better questions. Did demand drive the initial move? Did selling pressure weaken during the pause? Did volume expand when price cleared resistance? Is the flag shallow enough to preserve the original trend, or has the retracement damaged the setup?
You'll start with the pattern's mechanics and the psychology behind its three stages. Then you'll examine the price and volume characteristics that separate a recognizable flag from ordinary market chop. From there, the focus shifts to entries, stops, measured targets, chart examples, and the evidence behind reliability claims.
The goal isn't to memorize a shape and trade every resemblance. It's to build a repeatable process that keeps you from confusing a temporary pause with a guaranteed breakout.
What a Bull Flag Really Is and Why It Forms
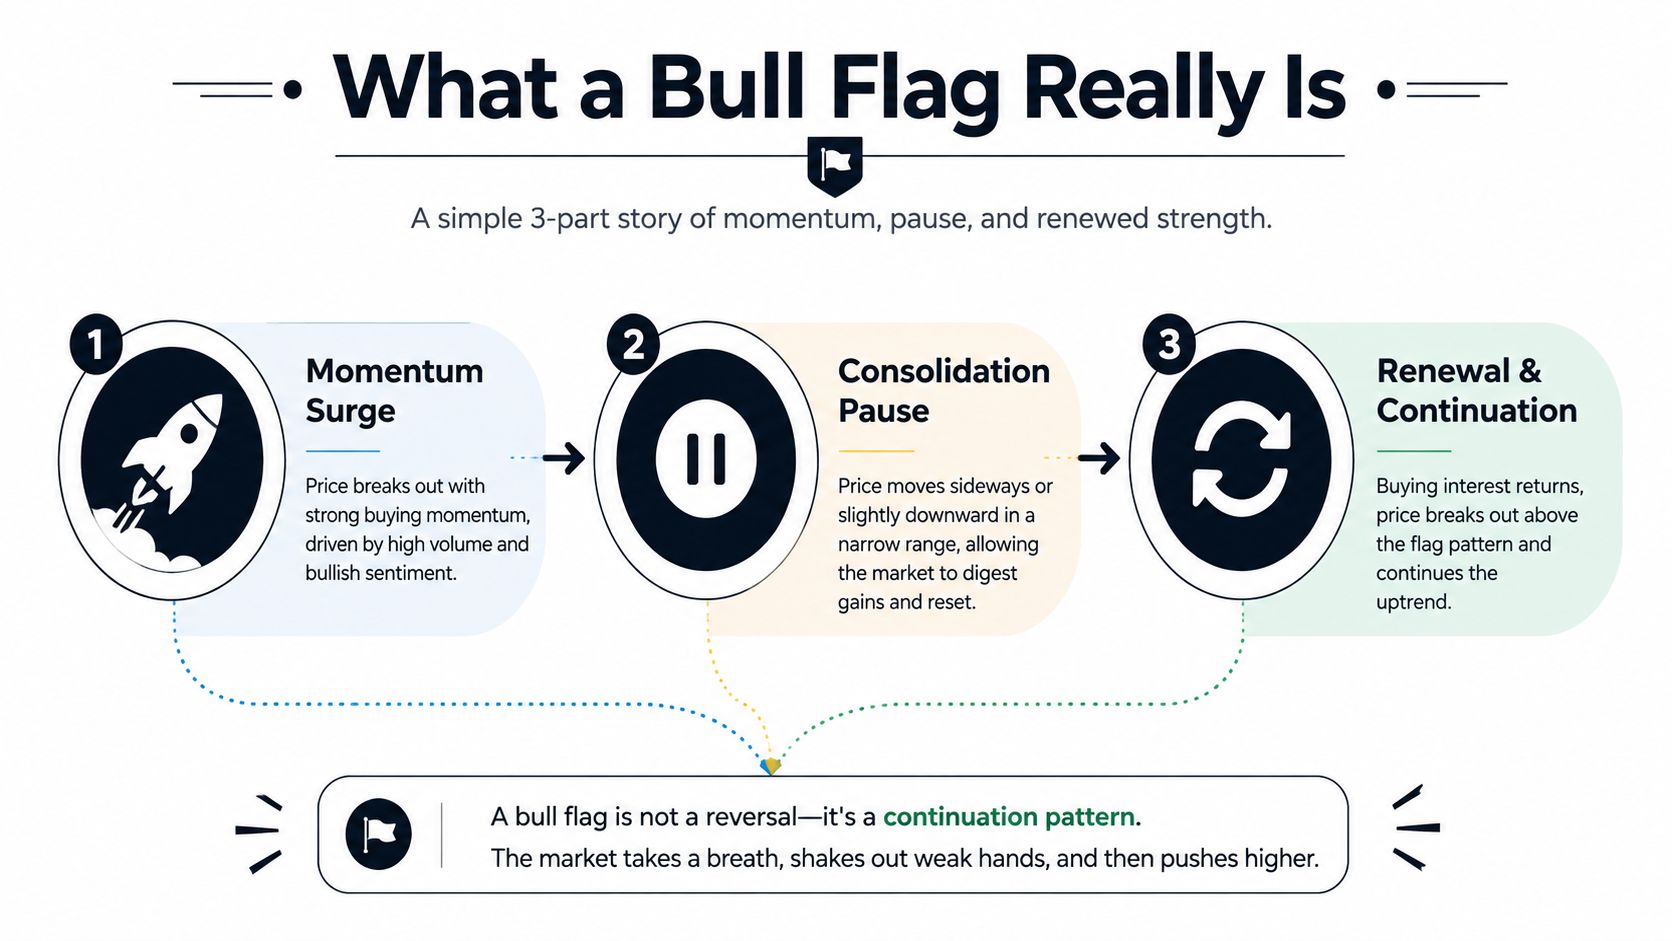
A bull flag is a bullish continuation pattern that typically follows a sharp advance and then a short consolidation. The initial rally creates the flagpole, while the consolidation forms a compact channel that often drifts sideways or slightly downward. The pattern becomes actionable only when price breaks above the flag's upper boundary, usually with renewed volume, as described in this bull flag trading explanation.
Think of a flag attached to a pole. The pole doesn't represent a slow, uncertain climb. It's the part of the chart where buyers show clear urgency. The flag is the pause that follows, as some participants secure profits and others assess whether the trend still has room to run. The breakout is the point where new demand attempts to take control again.
The three stages of the pattern
Stage one is momentum. Price makes a forceful upward move, often accompanied by increased trading activity. This move gives the consolidation its context. Without a meaningful advance, a small rectangle on a chart may be a range rather than a bull flag.
Stage two is consolidation. Price moves against the immediate trend or pauses in place. The range should look controlled rather than disorderly. Sellers may push price lower, but they aren't overwhelming demand. Buyers may also be waiting rather than aggressively chasing the earlier rally.
Stage three is renewal. Price clears the upper boundary of the consolidation. A move that only touches or briefly wicks above resistance isn't enough to establish convincing continuation. Traders generally want to see price accept levels above the flag and volume return as the breakout develops.
The market psychology is a temporary disagreement, not a complete change of direction. Profit-taking creates supply, but the supply may be absorbed without destroying the larger bullish structure. If sellers can't force a deep retracement and buyers step back in, the pause can resolve upward.
The pole shows urgency, the flag tests supply, and the breakout tests whether demand has returned.
This doesn't mean every sharp rise followed by a pause qualifies. A deep decline, expanding selling volume, or repeated failures at the upper boundary can weaken the interpretation. The shape only becomes meaningful when price behavior and participation support the continuation story.
Anatomy of a Valid Bull Flag and How to Spot It
A recognizable bull flag has several parts that work together. You're not looking for a perfect drawing. You're checking whether the price structure, retracement, duration, and volume tell a consistent story.
Start with the price structure
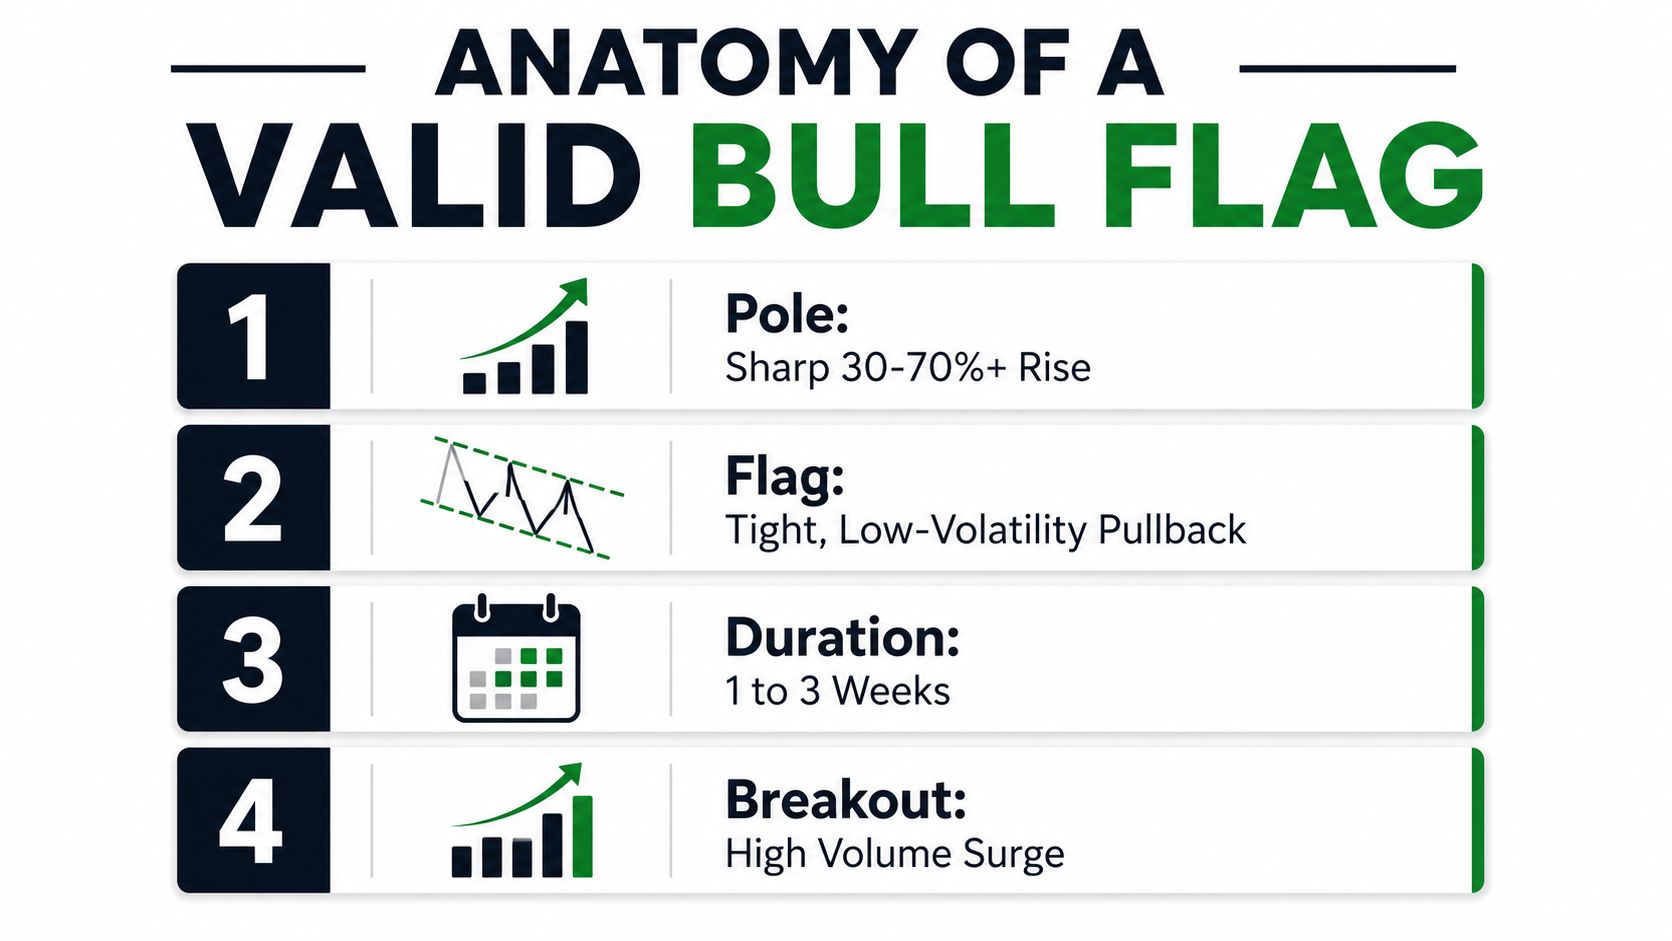
The flagpole should stand out as a strong upward advance. After it, the flag commonly appears as a tight rectangular channel or a slightly downward-sloping range. A mild pullback is normal, but a steep collapse changes the character of the formation.
One bull flag pattern reference describes the pullback as often less than 38% of the prior advance, while noting that some stock examples may last about three to five weeks. Crypto often compresses or extends these structures differently because its trading environment is continuous and highly variable, so treat those stock-oriented observations as context rather than a rigid crypto rule.
The flag should also preserve a sense of order. Lower highs and lower lows inside a modest channel can represent controlled profit-taking. Wide, erratic swings suggest that the market is struggling to maintain the original impulse.
Read volume as a sequence
Volume is one of the clearest filters available. During the pole, volume typically increases as buyers participate in the rally. During the flag, volume generally decreases, showing that the market is pausing rather than attracting aggressive new selling. If price breaks above resistance while volume expands again, the continuation case becomes stronger.
This bull and bear flag education from OANDA explains the common sequence of rising volume during the initial move, declining volume during consolidation, and renewed expansion on the breakout.
Use this checklist while studying a chart:
- Pole: A clear upward impulse that gives the pattern its bullish context.
- Flag: A compact sideways or gently declining channel, not an uncontrolled selloff.
- Retracement: A pullback shallow enough to leave the original trend structure intact.
- Participation: Volume contracts during the pause and expands as price clears resistance.
- Confirmation: Price breaks and holds above the upper flag boundary instead of producing only a brief wick.
The Relative Strength Index can provide additional context, but it shouldn't replace this structural analysis. You can review the RSI indicator in crypto to understand how momentum readings may complement, rather than define, a chart pattern.
A visual walkthrough can make these features easier to connect:
How to Trade a Bull Flag Breakout With Rules and Risk Control
Recognizing a bull flag and trading one are different skills. A chart can meet several visual criteria and still fail after entry, so the trade plan should define the trigger, target, and invalidation before you commit capital.
Build the setup before the breakout
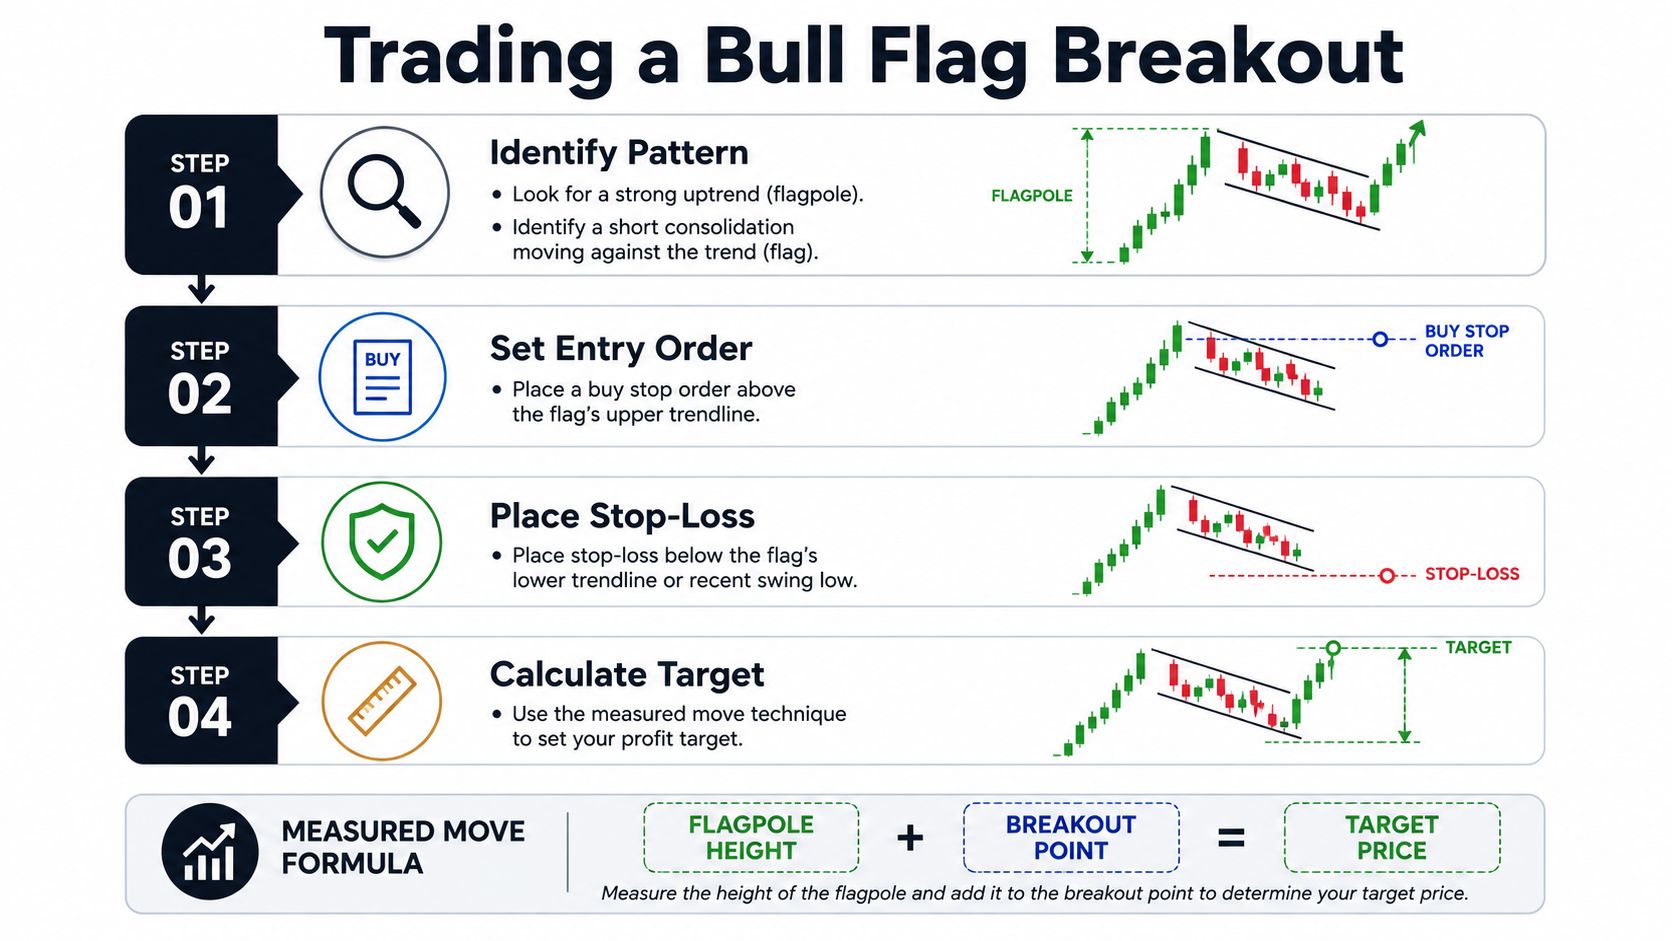
First, mark the flag's upper boundary and its lowest point. The upper boundary gives you the level where continuation would need to prove itself. The flag low provides a logical reference for risk because a decisive move beneath it suggests that the controlled pause has broken down.
A common measured-move method projects the flagpole height from the breakout point. In practical terms, measure the distance from the pole's starting point to its high, then add that distance to the level where price breaks above the flag. This is a projection, not a promise that price will reach the target.
For the stop, many trading guides place it below the flag low. That location keeps the risk tied to the pattern's structure rather than an arbitrary distance. A stop that sits too close can be triggered by ordinary volatility, while a stop that sits too far can make the position unsuitable for your risk limit.
Treat volume as confirmation
Some guides use breakout volume around 1.5x to 2x the recent or 20-day average as a practical confirmation benchmark, as outlined in this bull flag measured-move and volume guide. That range is a reference, not a universal requirement for every crypto asset or timeframe.
The important point is consistency. Decide what volume condition you'll accept before the breakout, then apply the same rule to future examples. A price move above resistance on weak participation deserves more caution than a decisive break accompanied by expanding activity.
A simple playbook looks like this:
- Identify the context: Confirm a strong prior advance and a controlled consolidation.
- Mark the trigger: Define the upper flag boundary and wait for a convincing break.
- Check participation: Compare breakout volume with your chosen baseline.
- Define invalidation: Place the stop below the flag low if that matches your risk plan.
- Project the objective: Add the pole's height to the breakout point for a measured target.
- Control exposure: Size the position so a stopped trade remains acceptable within your broader plan.
You can use this stop-loss guide for crypto trading to refine the risk side of the setup. GeckoScreener doesn't currently offer trading features or backtesting features, but backtesting and alerts will be live very soon, which can help traders evaluate and monitor rules such as these without relying only on visual memory.
Bull Flag Chart Examples You Can Learn to Recognize
The pattern becomes easier to understand when you compare examples from different markets. The goal isn't to copy a historical move. It's to train your eye to locate the same sequence: impulse, pause, boundary, and attempted continuation.
A Tesla stock example shows the classic equities presentation. Look for the sharp advance first, then inspect whether the consolidation forms a relatively orderly channel rather than a broad reversal. The upper boundary matters more than the visual resemblance. Until price clears that boundary, you're looking at a possible flag, not a completed continuation pattern. A Tesla bull flag chart example provides a visual reference for this version.
Forex examples help separate the pattern's structure from any one asset. AUDCAD and GBPUSD charts can show the same relationship between a strong move and a controlled countertrend pause. Currency pairs may display the pattern with different candle sizes and volume characteristics, so focus on the shape of the consolidation and the behavior around the breakout rather than expecting identical activity across markets.
Crypto adds another layer because timeframe changes the appearance and the reliability of the setup. A five-minute flag may form quickly and contain more noise, while a fifteen-minute or daily structure can give the boundaries greater visual significance. The same asset can also display several apparent flags at once, with a smaller intraday pattern sitting inside a broader daily trend.
As you inspect charts, ask:
- Does the pole clearly dominate the preceding price action?
- Does the flag remain compact, or does it retrace too aggressively?
- Do volume bars shrink through the pause?
- Does volume expand when price moves above resistance?
- Does the breakout hold, or does price immediately return inside the channel?
These questions turn chart images into exercises. Save examples that look clean, ambiguous, and failed. Comparing all three categories helps you avoid learning only the idealized version of the pattern.
How Reliable Is the Bull Flag and When It Fails
The phrase “bull flag” can sound more certain than the evidence supports. In Thomas Bulkowski's widely cited stock-market reference, standard bull flags reached a 5% break-even threshold 56% of the time, while 46% met the full measured-move target. The same reference reported a 9% average short-swing move after the pattern, which is why the setup is better understood as probabilistic rather than guaranteed. These figures are summarized in this crypto-focused bull flag analysis, which also discusses how results vary across markets.
Crypto tracking can produce a much less generous picture. In one independent dataset, 20.09% of 6,013 eligible upward families moved at least 5%. Stricter timeframe groupings produced 25.13% for patterns on five-minute-and-above charts and 35.68% for patterns on fifteen-minute-and-above charts. Those results don't translate into a universal crypto win rate, but they do show why asset class, timeframe, and detection rules matter.
Why the numbers can disagree
A peer-reviewed study covering the SSE Index and BOVESPA found that bull-flag trading rules produced annualized excess profit of 62.84% for BOVESPA and 103.83% for SSE in the best-fitting twenty-day window case. It also reported average excess returns of 6.70% and 5.12% at a 95% confidence level for two variants, with buy signals showing a success rate of around 80% across fitting windows. The study on bull flag trading rules makes the key limitation clear through its rule-based framing: results depend heavily on design, market regime, and confirmation criteria.
A large 2026 study of 24 million chart-pattern observations found more modest out-of-sample behavior. Bull flags showed an average 5-day forward return of +1.41% and 54.8% direction accuracy, while lower-confidence detections averaged +0.44% over five days with a 52% win rate, according to this analysis of bull flag detection outcomes.
The lesson is practical:
- Weak volume: A breakout without renewed participation can fail back into the range.
- Deep retracement: A flag that gives back too much of the pole may no longer represent a controlled pause.
- Poor context: A bullish shape inside a weak broader market can produce false continuation.
- Low-confidence structure: Loose boundaries and irregular swings make the pattern harder to trust.
- Immediate rejection: A wick above resistance followed by a close back inside the flag signals caution.
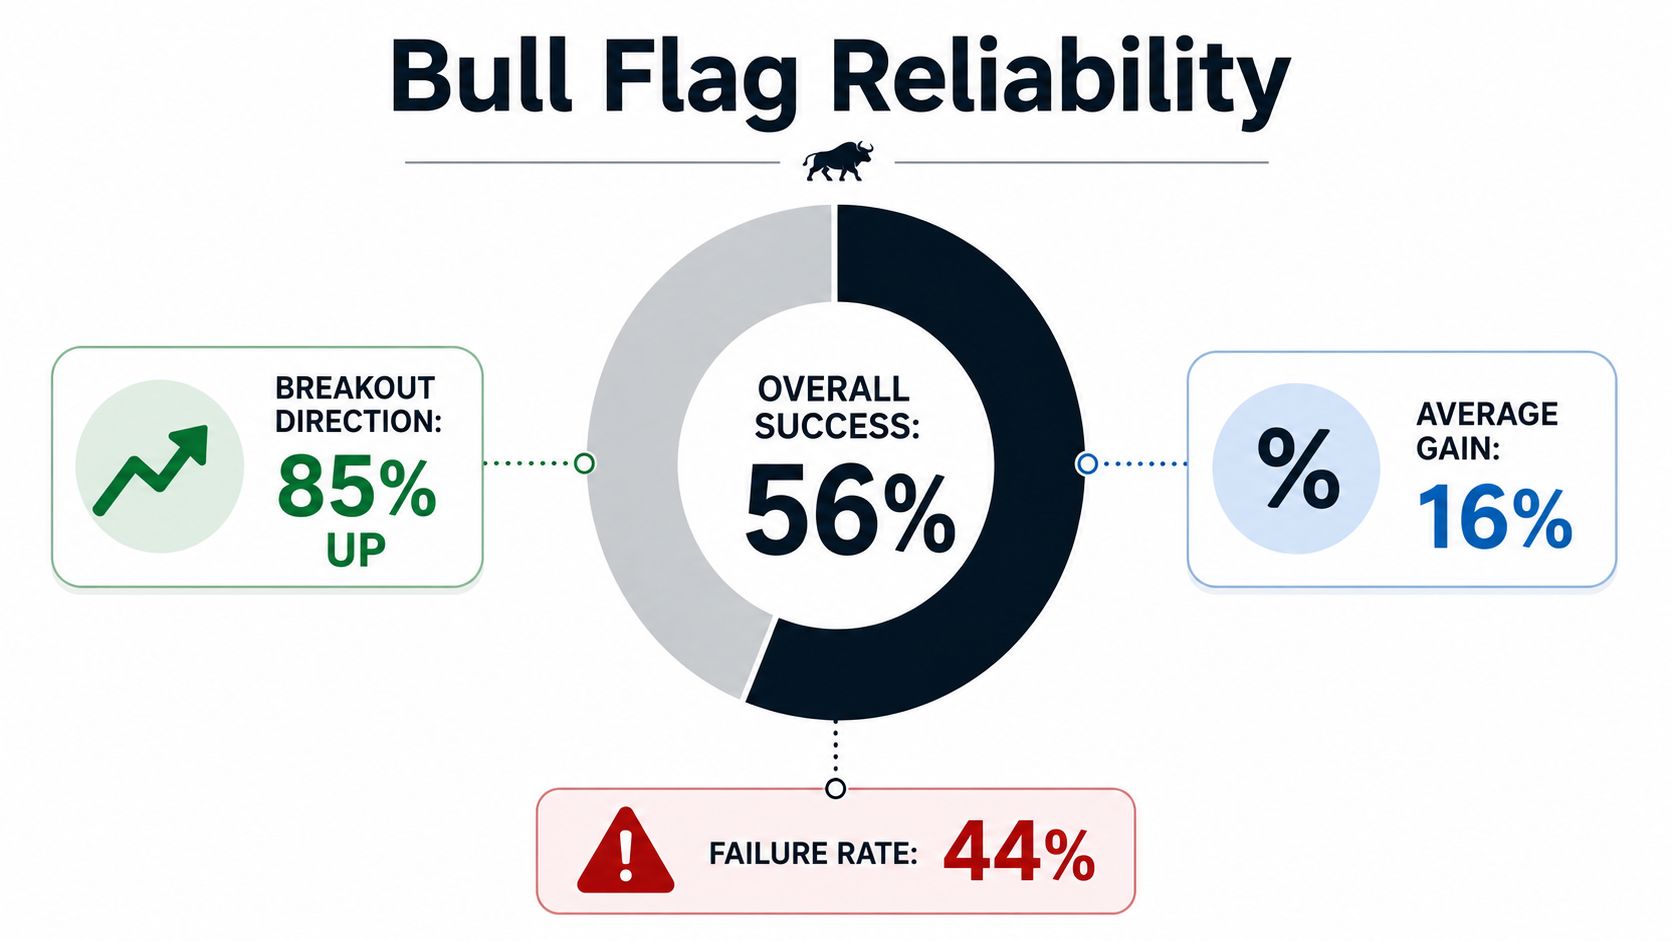
The supplied visual includes additional figures, but the verified performance data above should guide your expectations. A clean-looking pattern can improve decision quality by defining conditions, but it can't remove uncertainty.
Key Takeaways and Next Steps for Crypto Traders
A bull flag is a strong advance followed by a controlled pause and a possible continuation. The visual shape matters, but the surrounding evidence matters more. Start with the pole, inspect whether the flag remains shallow and orderly, then wait for price and volume to confirm that buyers are returning.
Keep the workflow simple:
- Screen for context: Look for a meaningful upward move before studying the consolidation.
- Inspect the pause: Reject loose, deep, or disorderly pullbacks.
- Wait for confirmation: Don't treat a resistance wick as a completed breakout.
- Define risk first: Know where the setup is invalidated before considering the target.
- Review by timeframe: A five-minute crypto flag can behave differently from a fifteen-minute or daily structure.
- Record the result: Save the chart, entry condition, volume context, stop location, and outcome.
The most common beginner error is chasing the first green candle after a pause. The second is treating a measured move as an entitlement rather than a planning reference. Patience helps because the trade only exists when your conditions are met, not when the chart merely resembles a flag.
GeckoScreener offers a crypto screener for monitoring the top 100 assets, with filters for indicators, volume, price action, and detected patterns. Its plain-language strategy builder is designed to turn entry, exit, stop-loss, and take-profit ideas into reusable queries, while backtesting and alerts will be live very soon. Use those capabilities as part of a deliberate research workflow, not as a substitute for understanding the structure.
Practice by collecting candidates, marking the pole and flag boundaries, and writing down what would confirm or invalidate each setup. Over time, you'll learn that the answer to “what is a bull flag in trading” isn't just a shape. It's a conditional market hypothesis that must earn your confidence through structure, participation, and risk control.
Use GeckoScreener to screen crypto assets for bullish chart conditions and organize repeatable trading ideas around entries, exits, and risk parameters. Visit the platform, save a few bull flag candidates, and return to them after the breakout or failure so your pattern recognition grows from documented evidence rather than hindsight.
GeckoScreener Team
Written for the GeckoScreener community. Join us on Telegram →
Related Articles


Start screening cryptocurrencies for free
Apply strategies like this one in real-time across 250+ coins.
Try GeckoScreener →