RSI Indicator Crypto: How to Read Momentum in Volatile
Learn to use the RSI indicator crypto to read momentum and make smarter trades in volatile markets.
GeckoScreener Team
Aug 13, 2026 · 13 min read
Updated about 1 month ago
RSI gets treated like a universal sell button far too often, and that's where crypto traders get trapped. In crypto, an RSI reading above 70 can keep climbing, an RSI below 30 can stay pinned, and momentum can stretch long after the textbook signal looks obvious (Investopedia's RSI overview). The rsi indicator crypto traders need isn't the rigid stock-market version, it's a regime-aware read on momentum, structure, and confirmation.
That matters because RSI was built to measure speed and magnitude of price moves, not intrinsic value. A fast market can look overheated for a long time and still keep trending, which is why a simple overbought or oversold label often causes premature exits and late entries. The edge comes from reading RSI as a tool for context, then adjusting the threshold to the market environment instead of forcing every chart into the same 70/30 box.
Table of Contents
- Why the Classic RSI Rules Fail in Crypto
- Understanding RSI Mechanics and the 14-Period Default
- Regime-Specific RSI Thresholds for Crypto Markets
- Making RSI Divergence Actionable
- Choosing the Right Timeframe for Your Trading Style
- Combining RSI with Other Indicators for Stronger Setups
- Screening and Validating RSI Setups with GeckoScreener
Why the Classic RSI Rules Fail in Crypto
The fastest way to misuse RSI in crypto is to treat above 70 as a guaranteed exit and below 30 as a guaranteed entry. That rule only works in quiet, range-bound markets. Crypto does not stay quiet for long. Bitcoin can hold an overbought reading through a strong trend leg, and the same reading that warns of exhaustion in one market can stay stretched in another without producing a reversal.
Momentum is not value
RSI does not tell you whether a coin is cheap. It tells you whether recent price action has been fast and one-sided. That distinction matters. In a strong rally, RSI can flag overbought while price keeps climbing because buyers are still in control. In a steep selloff, RSI can sit oversold while sellers keep pressing price lower.
A better reading is to treat RSI as a stress gauge for momentum. It shows when a move is extended, but it does not tell you whether the move is ready to reverse. Traders who ignore that often sell strength too early in bull markets and try to catch falling knives in downtrends.
Practical rule: RSI extremes are warnings, not trade commands.
If you want to know whether a setup held up the way you expected, review the trade after it closes. That discipline matters more than reacting to the label in isolation, and a basic framework for that is laid out in how to backtest trading strategies.
Why the 70/30 rule breaks first
Crypto volatility is the reason the classic thresholds fail so quickly in fast trends. During strong upside runs, price can stay stretched much longer than traders coming from slower markets expect. During sharp breakdowns, oversold readings can remain depressed while price keeps bleeding. A trader who uses 70/30 as a hard trigger often gets chopped up in the same places where trend traders stay with the move.
The better takeaway is straightforward. RSI works, but not as a universal trigger. It works as a momentum map, and crypto needs that map read through market regime, asset behavior, and confirmation.
Understanding RSI Mechanics and the 14-Period Default
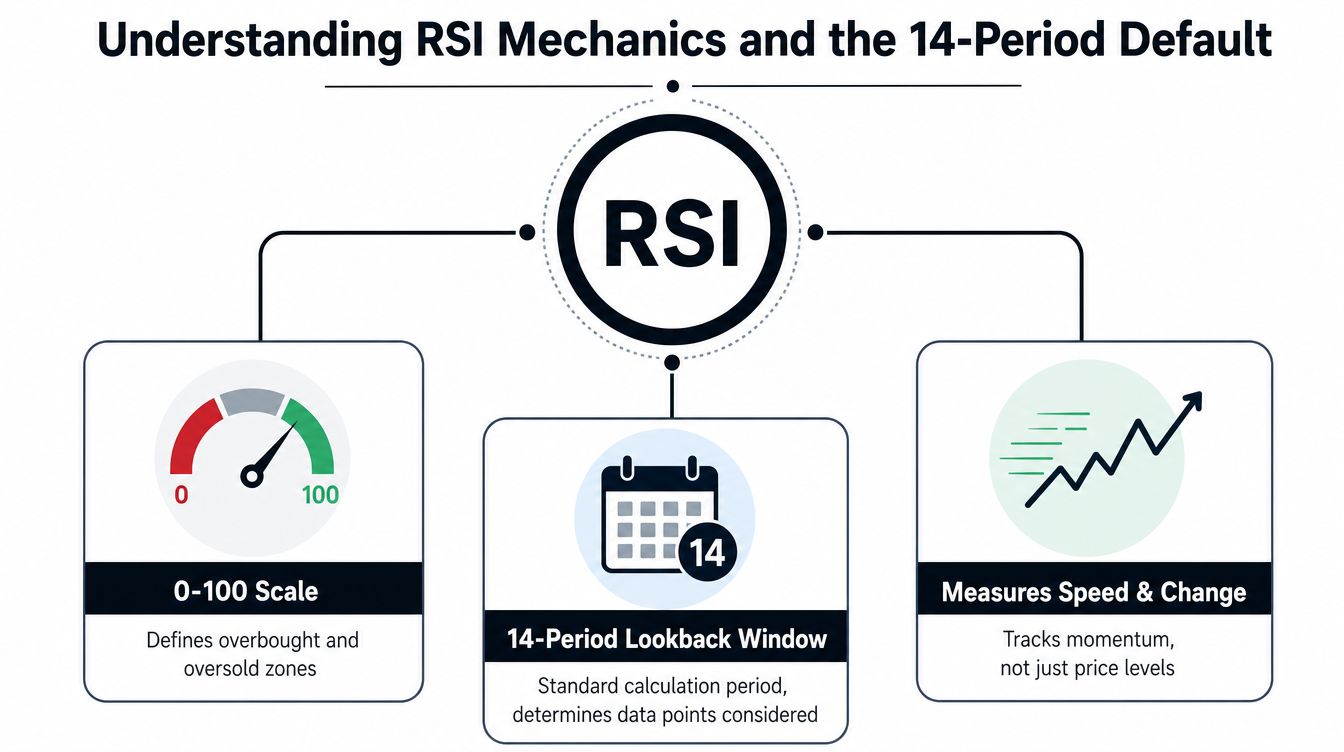
RSI is a 0 to 100 oscillator. The default setting most traders recognize is 14 periods, and that lookback stays popular because it balances responsiveness with enough smoothing to filter some noise. On a daily chart, 14 periods gives you a momentum read across roughly three weeks of candles. On a 1-hour chart, the same setting compresses into a much faster lens.
Read it like a speedometer
RSI works like a speedometer. It shows how hard price has been pushing in one direction, not whether the chart is “finished” or due for a reversal. That is why it remains useful in crypto even when it does not hand you a clean turning point. A coin can stay in a healthy uptrend while RSI stays high, because the indicator is measuring the intensity of the move, not whether the move is too high in absolute terms.
The default 14-period setting matters because it sits in the middle. Shorten the window and RSI reacts faster, but it also gets noisier. Lengthen it and you lose some of the short-term swings, but you get a smoother read on trend momentum. Traders who change the setting without changing the market context usually end up reading too much into normal volatility.
What the scale actually tells you
On the standard interpretation, above 70 suggests overbought momentum and below 30 suggests oversold momentum. Investopedia These levels are reference points for stretched conditions, not automatic reversal zones. In crypto, the same reading can mean very different things depending on whether the market is trending, breaking down, or stuck in a range.
That is the part traders miss when they treat RSI as a standalone signal. A high reading during a strong impulse can mean buyers are still in control. A low reading during a selloff can mean sellers have not finished pressing price lower. RSI becomes more useful when you ask whether momentum is expanding, stalling, or slipping out of character, then wait for the chart structure to confirm that read.
A crypto trader does not need RSI to predict every turn. RSI just needs to reveal when momentum is compressing, expanding, or fading, so the rest of the setup can be judged with better context.
Regime-Specific RSI Thresholds for Crypto Markets
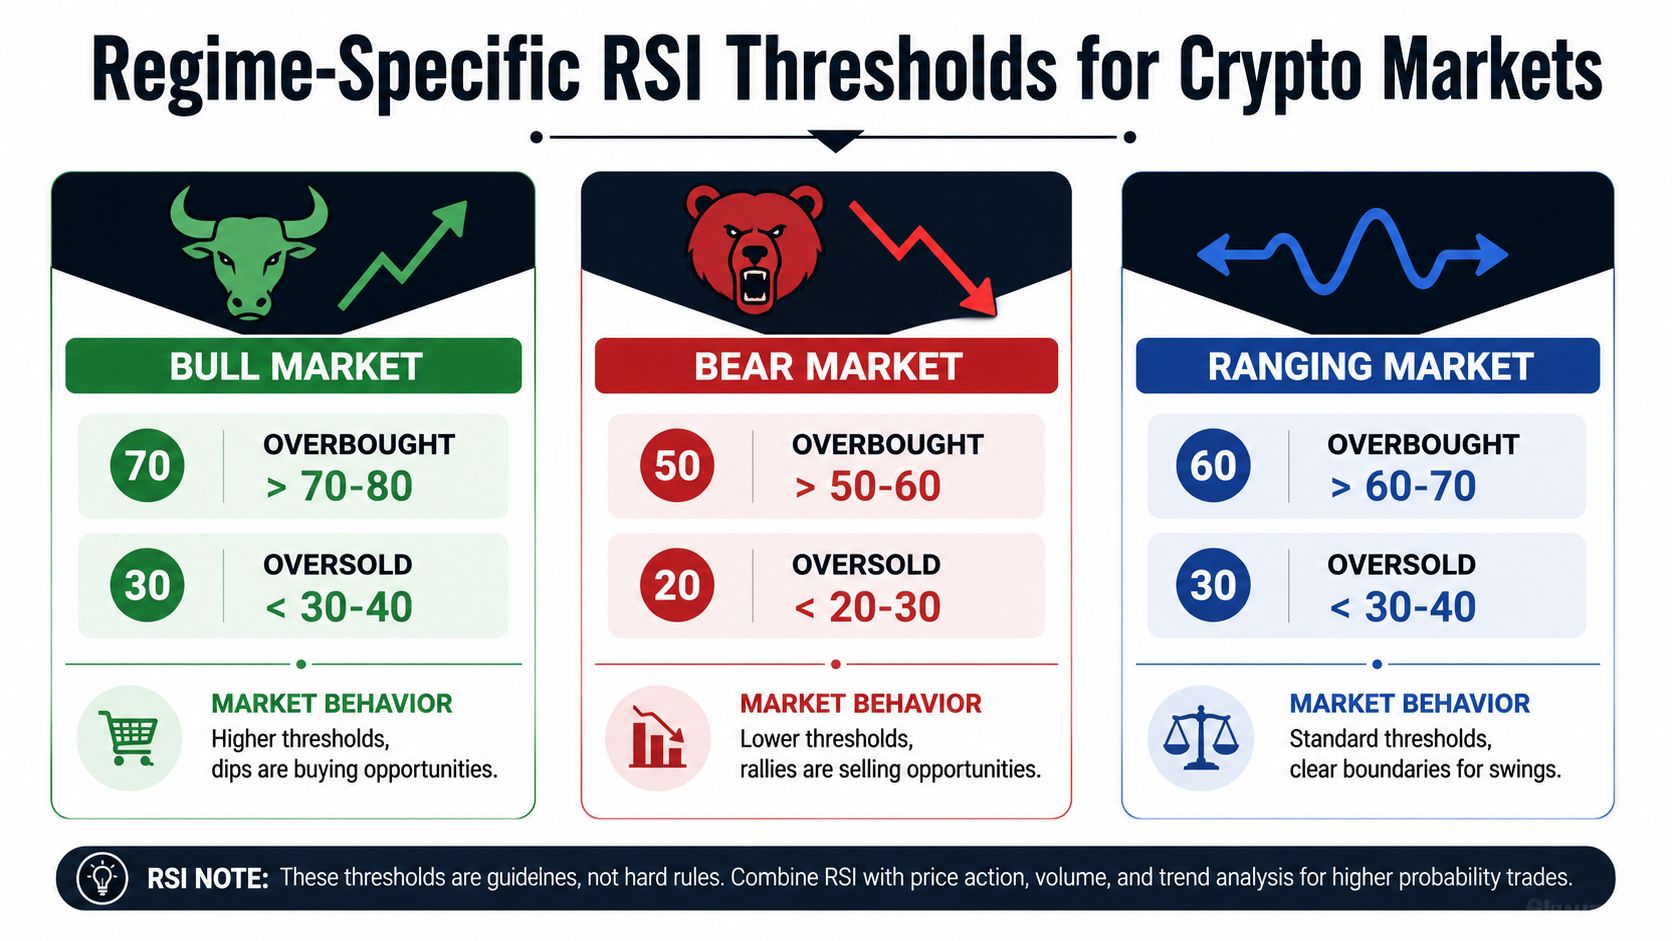
The classic 70/30 split works best in flat conditions, and crypto spends a lot of time outside that comfort zone. In bull markets, RSI often holds above higher support zones and keeps pressing into higher territory. In bear markets, weak rallies can stall earlier and downside can persist longer. In ranges, the classic rule regains some value because price moves between more defined boundaries (cryptint.io's RSI crypto guidance).
Match the band to the regime
The practical rule is simple. In a bull market, traders often use 80/40 because momentum stays bid and pullbacks can reset at higher levels. In a bear market, 60/20 fits better because rallies fail sooner and oversold conditions can stay in place longer. In a ranging market, the classic 70/30 framework still has the cleanest logic because price keeps rotating between acceptance and rejection zones.
That regime shift is what many retail explainers miss. They teach one threshold and expect it to work everywhere. Crypto punishes that kind of rigidity. If the broader trend is strong, an RSI above 70 may be normal, not a warning. If the market is weak, the same reading may be early.
Trading edge: the more directional the market, the less useful the default overbought and oversold lines become.
Asset type matters too
Bitcoin usually behaves differently from smaller altcoins. The same source also separates bands for BTC, large-cap alts, and smaller alts, with extreme overbought moving from above 80 for BTC to above 90 for altcoins (cryptint.io's RSI crypto guidance). That fits how these assets trade. Lower-cap coins can whip through extremes much faster, so a threshold that works on Bitcoin may be too conservative for a volatile alt.
The cleanest decision process is to ask two questions before acting. First, is the market trending or ranging? Second, is the asset a large-cap anchor or a faster-moving alt? Answer those two and the RSI line becomes much easier to read.
Making RSI Divergence Actionable
Divergence is one of the more useful RSI patterns in crypto, but traders get into trouble when they treat it as a standalone trigger. Bullish divergence shows up when price prints a lower low while RSI prints a higher low. Bearish divergence shows up when price prints a higher high while RSI prints a lower high. That is the setup, not the entry.
Divergence needs context
The strongest divergence signals usually appear near RSI extremes, not in the middle of the range. That matters because mid-range divergence can show disagreement without enough pressure behind it to mean much. Crypto also tends to keep extending after the first signs of weakening momentum, so a trader who enters too early often gets run over.
The better read is to wait for structure to confirm the turn. A break of market structure, a strong candle close, a clear reaction at support or resistance, or a visible volume response all improve the odds that divergence is turning tradable. Without that, the trade is often just a pause inside a stronger trend.
What confirmation looks like in practice
A practical sequence is easy to follow.
- Price makes the setup: a higher high or lower low appears while RSI disagrees.
- Structure reacts: the market loses a key level, rejects a zone, or closes strongly away from the extreme.
- Participation shows up: volume expands or the candle body shows the move was not just a thin wick.
- Entry follows the reaction: not the divergence itself.
That sequence cuts down on false signals. In crypto, false positives are common because momentum can keep stretching after the indicator starts disagreeing with price.
Divergence works better as a setup filter than as a button to click. A trader who waits for confirmation gets fewer signals, but the ones that remain are far more usable.
Choosing the Right Timeframe for Your Trading Style
RSI behaves very differently depending on where you look. A 15-minute chart will throw off many more signals than a weekly chart, but more signals doesn't mean more edge. Lower timeframes are faster and noisier. Higher timeframes are slower and cleaner. The right choice depends on whether you're day trading, swing trading, or holding positions longer.
| RSI Timeframe Selection Guide | Best For | Signal Reliability | Typical Holding Period |
|---|---|---|---|
| 15-minute | Scalp-style entries, very short-term reaction trades | Lower | Minutes to a few hours |
| 1-hour | Intraday momentum and fast swing starts | Moderate | A few hours to a couple of days |
| 4-hour | Swing trading and structure-based setups | Higher | Several days |
| Daily | Swing and position context, stronger divergence reads | Higher | Days to weeks |
| Weekly | Macro trend framing and major cycle context | Highest, but slowest | Weeks to months |
Match the chart to the trade
If the goal is a quick intraday trade, the lower timeframes can be useful, but they will also produce more false positives. If the goal is to catch a broader move, the daily and weekly charts usually give a cleaner read. A daily RSI divergence matters more because it reflects a larger amount of traded momentum than a 15-minute wiggle.
Multi-timeframe work is where RSI becomes more reliable. Checking a daily chart for the broader bias and a 4-hour chart for the actual setup keeps traders from taking a low-timeframe signal that runs directly into higher-timeframe resistance.
A signal that looks clean on a small chart can still be dead on a larger one.
That's why the same RSI reading should never be judged in isolation from timeframe. The indicator isn't lying, but it is speaking a different dialect on every chart.
Combining RSI with Other Indicators for Stronger Setups
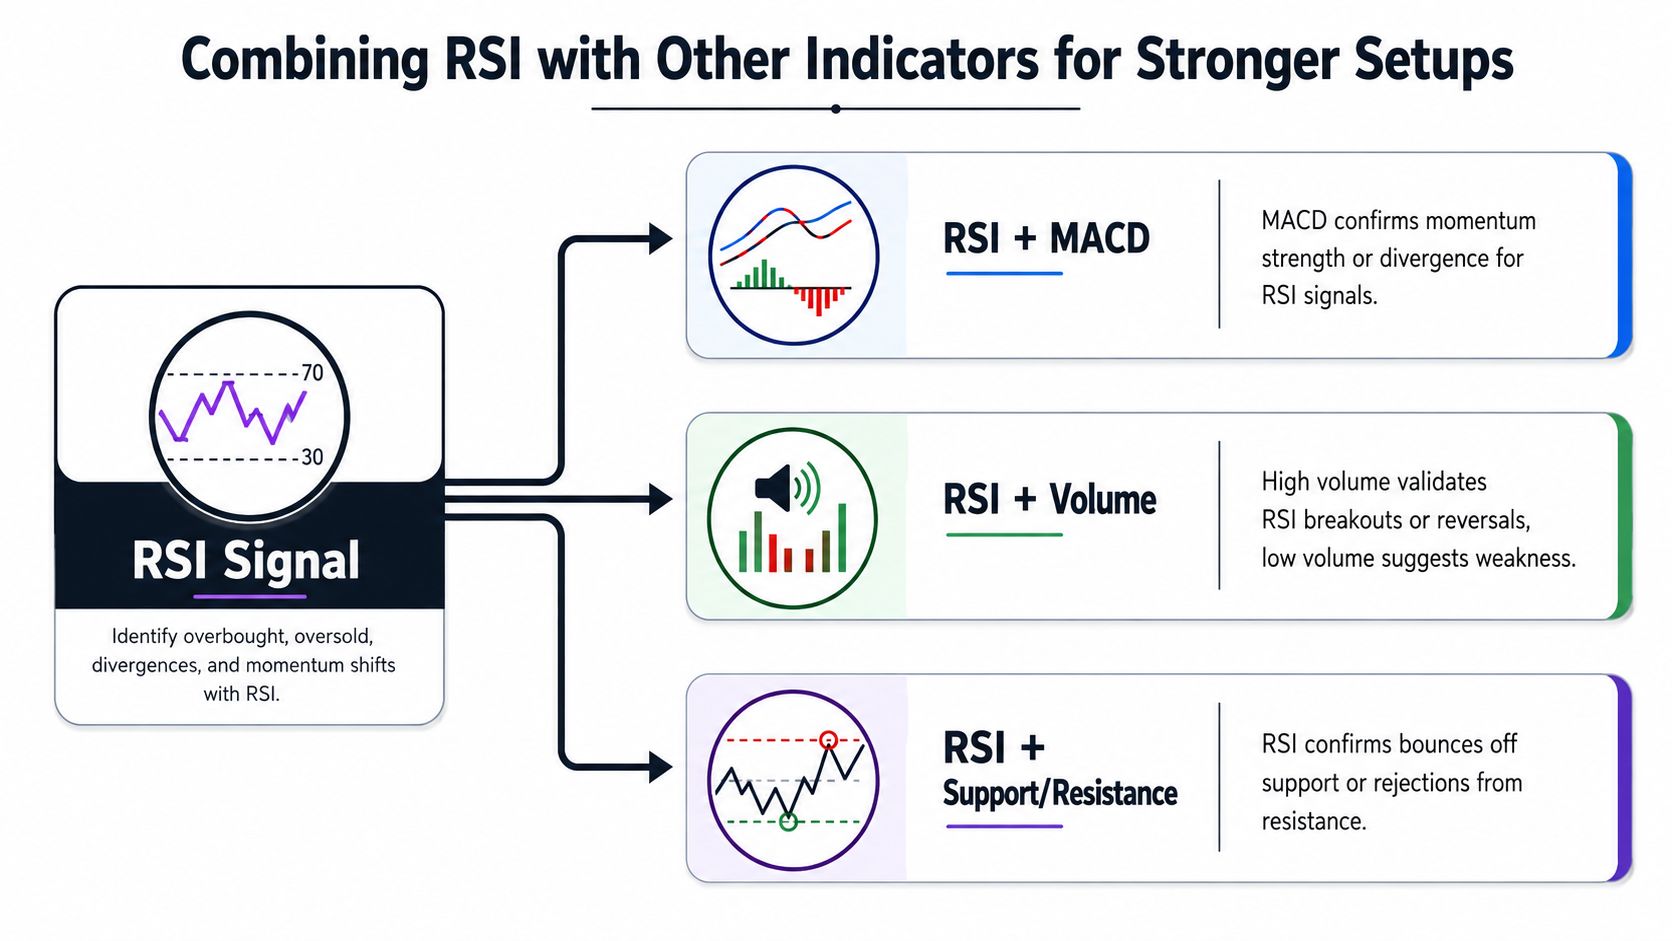
RSI is strongest when it acts as the first filter. MACD, volume, and price structure then decide whether the setup deserves capital. That's the practical way to use it. The indicator identifies stretched momentum, and the rest of the chart tells you whether the market is ready to turn or continue.
Three combinations that work better than RSI alone
RSI + MACD gives momentum confirmation. If RSI starts moving out of an extreme and MACD is also rolling over or crossing in the same direction, the odds improve that momentum is shifting instead of pausing. This pairing is useful because both tools are reading impulse, but from different angles.
RSI + volume checks conviction. If RSI breaks out of oversold territory but volume stays thin, the move may not have enough participation behind it. If volume expands on the reaction, the market is showing real engagement.
RSI + support and resistance adds location. An RSI bounce near support is more meaningful than an RSI bounce in the middle of nowhere. The same goes for rejection near resistance. The level gives the RSI reading a place to matter.
The broader point is simple. RSI should rarely be the final reason to trade. It works better when it identifies the condition and another tool confirms the trigger. That same logic shows up in broader indicator stacks, which is why a practical overview of the best indicators for crypto trading usually pairs momentum with structure, not one alone.
If RSI says the market is stretched, wait for the chart to prove it.
A simple entry sequence
A clean long setup might look like this. RSI leaves oversold territory, a bullish engulfing candle forms, support holds, and volume rises with the move. That's the sort of confluence that turns a raw oscillator reading into something tradable. The reverse works for shorts near resistance with bearish confirmation.
The point isn't to add more indicators for decoration. It's to make RSI harder to fake out.
Screening and Validating RSI Setups with GeckoScreener
A trader doesn't need to eyeball every coin manually. A screener can narrow the field to assets that already meet the momentum conditions. GeckoScreener is one option that lets traders filter crypto assets by RSI, combine that with other indicator or candlestick conditions, and then validate the setup in a backtest workflow using its no-code strategy builder and history tools.

A practical routine is straightforward. Screen for coins that meet your RSI threshold, add a confirming condition like a bullish candle pattern or MACD crossover, and then review the resulting equity curve and trade history before risking capital. The platform also supports saved strategies and a plain-language query builder, which helps turn a rule like “RSI below 30 and bullish hammer” into something executable without coding, as described in the GeckoScreener complete guide.
That workflow matters because RSI by itself only points to momentum extremes. A screen plus validation step shows whether the setup behaved well across past market conditions. Traders who want systematic entries can also keep an eye on the upcoming alerts feature for real-time setup notifications once it's live.
If you want a cleaner way to screen RSI setups, compare confirmation filters, and review historical trade behavior in one place, visit GeckoScreener. It gives you a practical workflow for finding RSI-based opportunities and checking whether they hold up before you put capital behind them.
GeckoScreener Team
Written for the GeckoScreener community. Join us on Telegram →
Related Articles



Start screening cryptocurrencies for free
Apply strategies like this one in real-time across 250+ coins.
Try GeckoScreener →