8 Best Crypto for Swing Trading in 2026
Compare the 8 best crypto for swing trading using liquidity, volatility, setups, GeckoScreener filters, chart examples, and risk notes.
GeckoScreener Team
Aug 18, 2026 · 19 min read
Updated about 2 months ago

The most volatile coin usually isn't the best crypto for swing trading. A tradable swing needs liquidity, persistent movement, a readable chart, catalyst timing, and defined downside, not just a dramatic percentage move. Thin order books can turn a technically correct entry into a poor fill, while deeper markets give traders more realistic exits.
That distinction matters in the current market. Schwab measured Bitcoin's 2025 historical volatility at 42%, with an ATR-to-price ratio of 3.4%, while Ether measured 75% volatility and 5.9% ATR/P. Those readings were lower than in 2021, but still leave room for multi-day setups. Schwab's crypto market charts also recorded Bitcoin's largest 2025 drawdown at 32%, widening to 50% between August 2025 and February 2026.
This list ranks BTC, ETH, SOL, MATIC, LINK, XRP, ADA, and DOT by the kind of swing opportunity they offer. GeckoScreener can currently screen indicators, candlestick patterns, volume, and price action. Backtesting and alerts aren't live yet, and the backtesting waitlist is collecting user interest ahead of the launch. Every chart example below is a historical illustration, not a guarantee, and each setup should be accompanied by a chart image so readers can inspect the pattern in context.
Table of Contents
- 1. Bitcoin BTC, the foundation for swing trading volatility
- 2. Ethereum ETH, the altcoin proxy with strong pattern recognition
- 3. Solana SOL, the high-velocity swing candidate
- 4. Polygon MATIC, the Layer 2 scaling play
- 5. Chainlink LINK, oracle utility with data-driven volatility patterns
- 6. Ripple XRP, regulatory catalyst swings with clear technical setups
- 7. Cardano ADA, deliberate development cycles
- 8. Polkadot DOT, the multi-chain catalyst swing
- Top 8 Cryptos: Swing Trading Comparison
- Turn the shortlist into a rules-based watchlist
1. Bitcoin BTC, the foundation for swing trading volatility
Bitcoin's deep liquidity and clear macro sensitivity make it the first asset traders screen for swing setups. Its market depth generally supports more dependable entries and exits than smaller tokens, while its volatility still creates room for multi-day trades. Schwab's 2025 readings, 42% historical volatility and a 3.4% ATR-to-price ratio, show why BTC can offer movement without forcing traders toward fragile markets. Bitcoin's 50% drawdown from August 2025 to February 2026 also sets a practical risk boundary: a readable chart does not remove substantial downside.
A BTC screen should begin with a correction into an established support level. On a 4-hour chart, combine an RSI reading below 35 with a MACD histogram that starts turning positive, then check for a Hammer or Engulfing candle at support. This combination signals a possible momentum shift, not a confirmed bottom. The trade becomes more testable when the support level defines a clear invalidation point.
Chart example and execution caveat
The supplied historical illustration shows a March 2024 Hammer near $63,000, followed by a move toward $71,000 over 12 trading days. Since those levels and the outcome come from the supplied example rather than a linked, independently verified source, use them only to examine entry logic, confirmation, and risk placement.
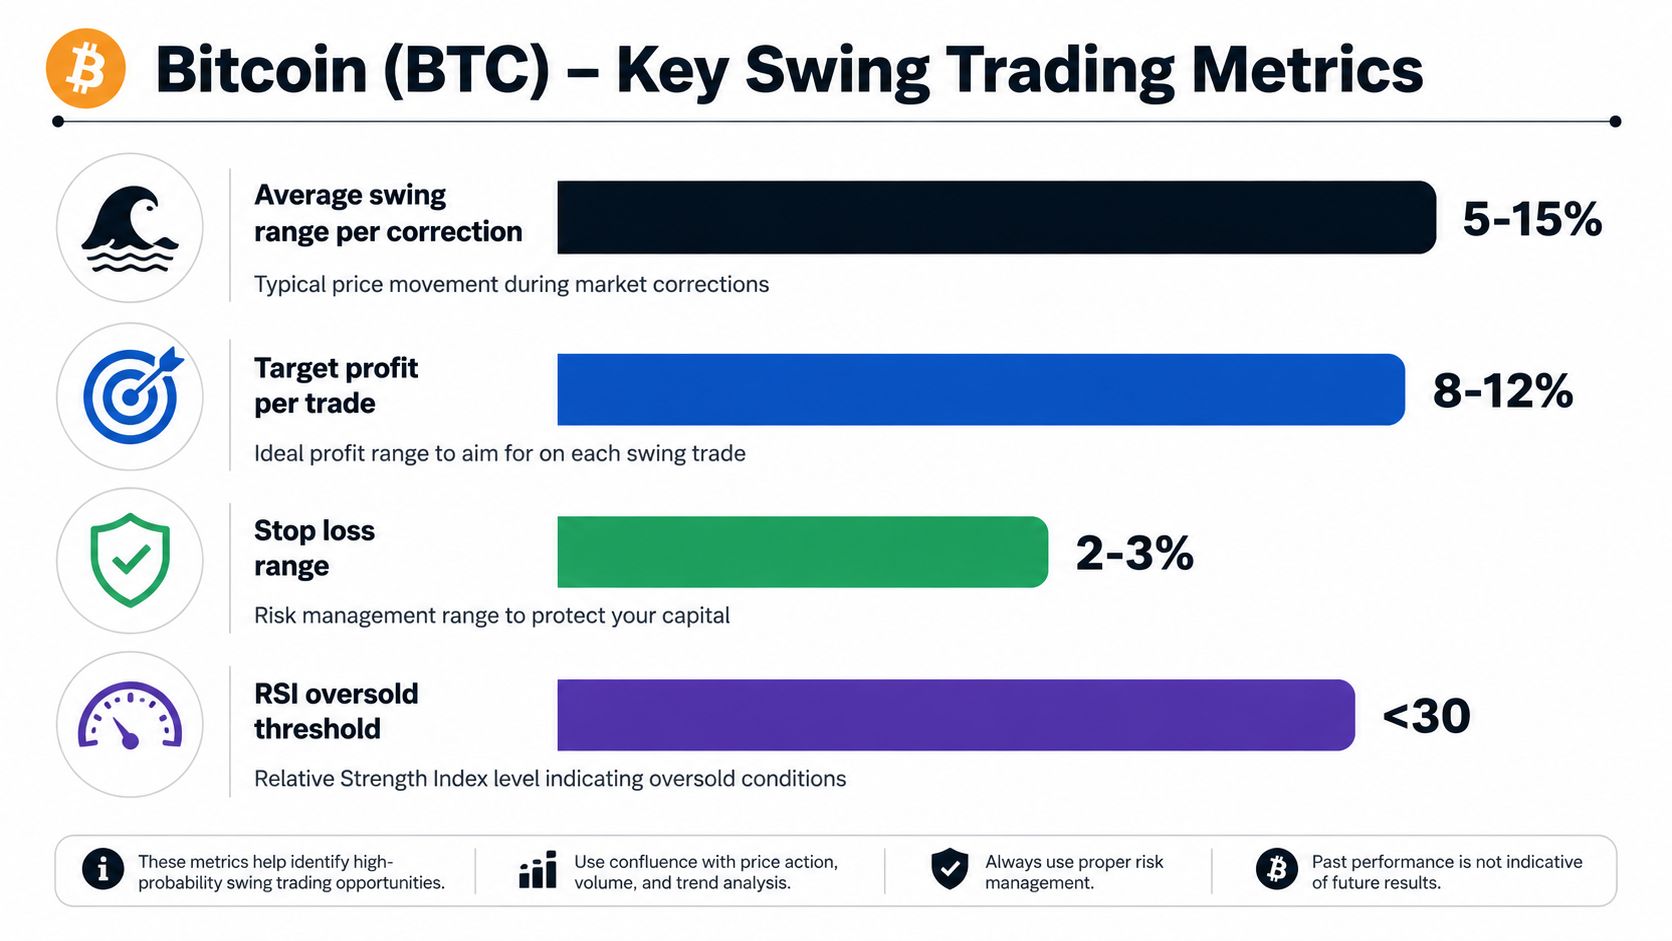
Practical rule: Give greater weight to a BTC reversal when volume expands and the candle forms at a level visible on both the daily and 4-hour charts.
BTC dominance adds a portfolio-level filter. Rising dominance can point to weaker relative performance from altcoins, so traders may use it to delay or re-enter broader altcoin exposure rather than treat every altcoin signal independently.
GeckoScreener can screen the technical conditions now, including indicators, patterns, volume, and price action. Its guide to backtesting crypto trading strategies describes historical validation, but backtesting is part of the upcoming feature and waitlist, not a currently available platform function.
2. Ethereum ETH, the altcoin proxy with strong pattern recognition
Ethereum's 2025 historical volatility was 75%, with an ATR-to-price ratio of 5.9%, according to Schwab-referenced market data. Those readings point to larger swings than BTC while ETH retains large-market liquidity. Screen for ETH when volatility is active, then check whether the move reflects Ethereum demand or follows Bitcoin.
ETH offers a clear technical framework when a pattern forms near an identifiable catalyst. A daily Inverse Head and Shoulders, Pennant, or range breakout supplies measurable confirmation and invalidation levels. On GeckoScreener, combine ADX above 25 with a Pennant to focus on markets developing directional movement rather than drifting sideways. Use the result as a shortlist, then inspect volume, retests, and BTC-relative performance on the chart.
Use divergence as the decision point
Network upgrades and improvement proposals can create event windows for ETH. The screening question is whether price has already cleared resistance, volume supports the break, and ETH is outperforming BTC on the same timeframe. Divergence between ETH and BTC can separate an Ethereum-led setup from a broader market bounce.
An April 2024 example in the supplied brief shows an Inverse Head and Shoulders near $2,900, followed by a move toward $3,350 over 10 trading days. A November 2023 Pennant example describes movement from $1,950 to $2,380 after upgrade anticipation. These chart illustrations provide context, not a basis for assuming the same return.
The retest often determines whether the breakout remains valid. Former resistance should hold as support, and volume should not collapse immediately after the initial move. Traders examining rejection structures can use the swing failure pattern guide to distinguish a failed breakout from continuation. GeckoScreener currently supports screening indicators, patterns, volume, and price action. Backtesting remains part of the upcoming feature and waitlist, not a currently available function.
3. Solana SOL, the high-velocity swing candidate
Solana belongs on a swing watchlist for a different reason than BTC and ETH. SOL tends to offer faster momentum and sharper reactions to ecosystem news, so the trade often develops over a shorter holding window. That speed can help a trader capture a defined breakout, but it also increases the cost of entering late. Liquidity must be checked alongside volatility, particularly when an announcement produces a crowded move.
The most useful SOL filter combines MACD crossover, ADX above 30, and a Hammer or Bullish Engulfing pattern on the 4-hour chart. The pattern provides location, MACD provides momentum direction, and ADX helps distinguish a developing trend from a random oscillator turn. Volume expansion is the final confirmation. A signal without participation is easier to invalidate.
Trade the catalyst, then the structure
Solana catalysts can include ecosystem launches, validator developments, and partnerships. A trader shouldn't buy merely because an event appears on a calendar. The better process is to mark the pre-event range, identify the breakout level, and decide in advance whether a failed retest invalidates the idea.
The supplied May 2024 example describes a Bullish Engulfing candle near $139 after a four-day pullback, followed by a move toward $170 over six trading days. Another example describes Three White Soldiers near $108 and a move toward $127 over five days. Those examples show how candle structure can organize a trade thesis, but they don't establish a future probability.
SOL also illustrates why liquidity timing matters. Amberdata's research on temporal market depth found Bitcoin depth at the 10-basis-point level peaked around $3.86 million at 11:00 UTC and fell to $2.71 million at 21:00 UTC, a 1.42x intraday liquidity spread. The study also identified 24% of observations as high-volatility periods, clustered around Europe's open, major U.S. macro releases, and the U.S. session close. The application for SOL is direct, use deeper-liquidity periods for entries and avoid treating every news spike as a reliable fill.
For indicator context, traders can also review GeckoScreener's crypto RSI indicator explanation before building a SOL screen.
4. Polygon MATIC, the Layer 2 scaling play
Polygon offers a hybrid swing thesis. MATIC can respond to broader Ethereum sentiment while also reacting to Polygon-specific developments, including scaling plans and zkEVM-related updates. That makes the token useful for traders who prefer ecosystem-linked mean reversion rather than the fastest momentum available in the market.
A daily chart is appropriate for the initial scan. Look for RSI below 40, ADX above 25, and a Morning Star forming at established support. RSI identifies a weakened move, ADX tests whether a trend has enough strength to matter, and the candlestick pattern provides a possible reversal trigger. The setup is stronger when volume confirms the turn and weaker when the candle appears inside a low-volume range.
The supplied March 2024 illustration describes a Morning Star near $0.68 and a move toward $0.79 over eight trading days. A January 2024 example describes a Bullish Harami near $0.72 and a move toward $0.80 over five days. These figures are included as historical illustrations from the supplied brief, not verified performance statistics.
Separate ecosystem evidence from chart evidence
Polygon traders should distinguish an announcement from a completed trend. A development update may create attention, but price still needs to reclaim resistance and hold it on a retest. Compare MATIC's volume with ETH's volume on the same timeframe. If MATIC's activity expands while the broader Ethereum complex remains quiet, the move may be token-specific. If both rise together, the trade may depend more heavily on sector-wide risk appetite.
The main caveat is execution during sudden repricing. A gap or long wick can make a fixed stop less realistic than the chart suggests. Define the invalidation level first, then size the position around the distance to that level rather than around a desired profit target.
5. Chainlink LINK, oracle utility with data-driven volatility patterns
Chainlink offers a distinct setup because its narrative can be tied to oracle integrations, DeFi activity, and infrastructure adoption, rather than only to broad market direction. That doesn't make LINK independent of crypto sentiment. It does mean that an integration announcement or changing DeFi conditions can give traders a specific catalyst to test against the chart.
A useful GeckoScreener screen combines RSI below 45, a positive MACD crossover, and a Piercing Line or Harami pattern on the 4-hour timeframe. The sequence matters. A low RSI alone can remain oversold during a downtrend. A MACD crossover alone can occur late. A reversal candle at support gives the signal a location that can be invalidated cleanly.
The chart should confirm the headline
The supplied April 2024 illustration describes a Piercing Line near $16.50, followed by a move toward $18.90 over seven trading days. A December 2023 example describes an Inverse Head and Shoulders near $14.00 and a move toward $16.50 over 10 days. These examples demonstrate how traders can map a catalyst to a pattern, but they don't prove that the same structure will produce the same result again.
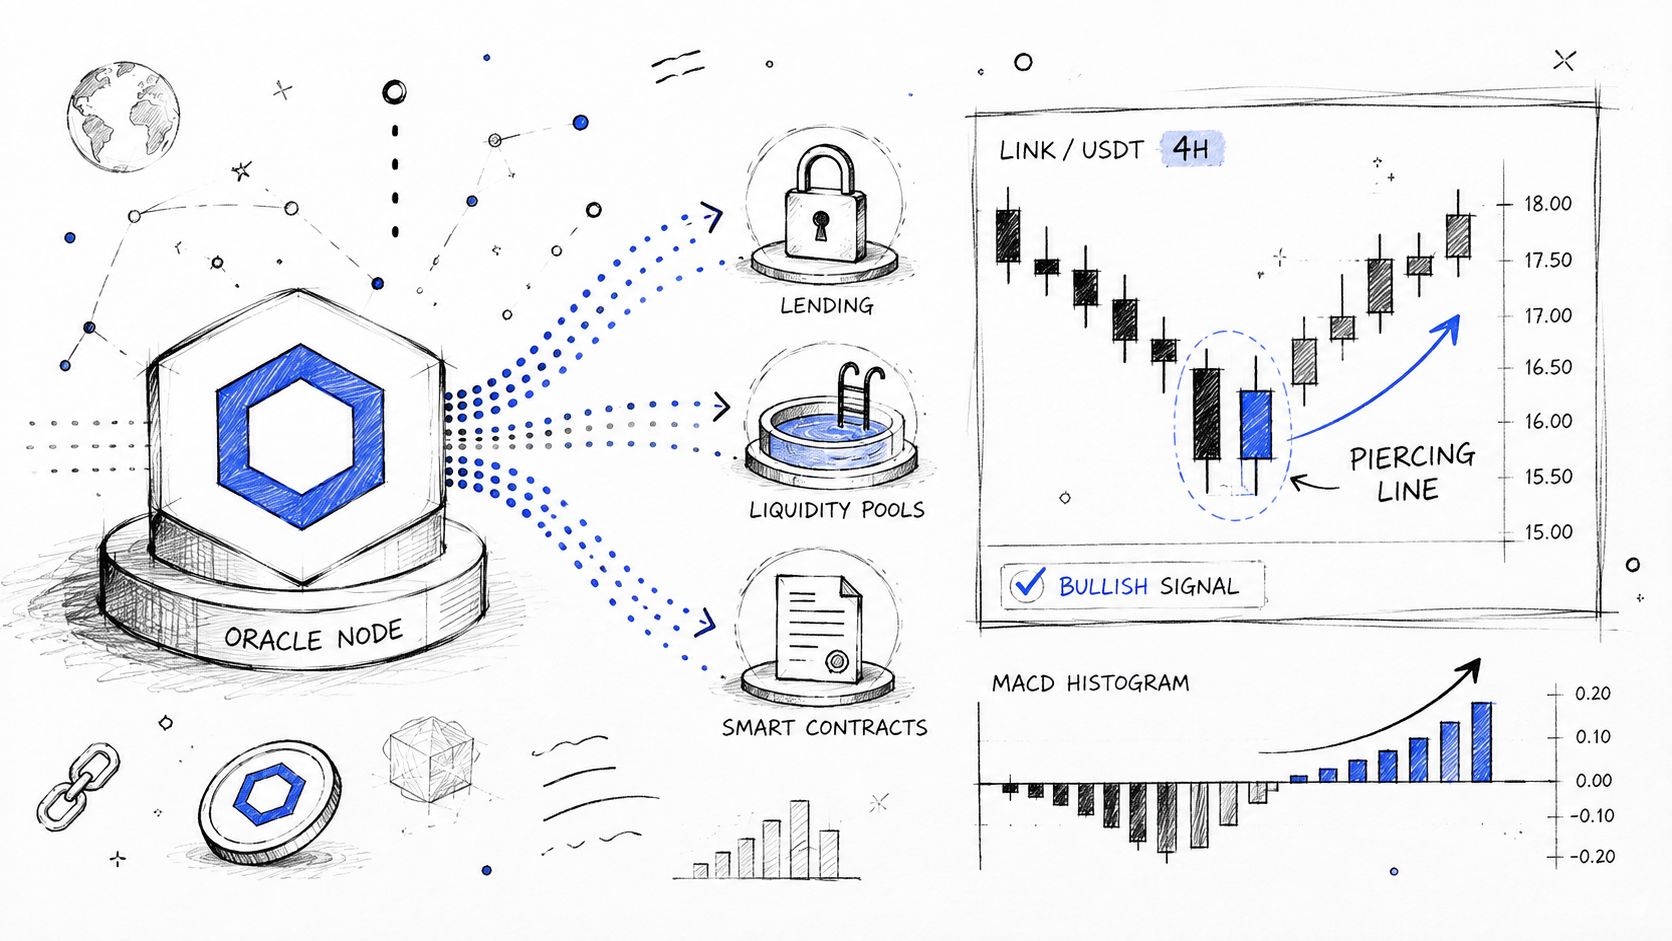
A LINK integration is a reason to inspect the chart, not a reason to ignore the chart.
Compare LINK with other oracle tokens and examine whether its relative strength persists after the announcement. A one-candle spike with declining follow-through suggests a headline trade. A breakout followed by higher lows and sustained volume offers a more coherent swing structure. Traders should also verify spread and order-book conditions before sizing, because a strong chart pattern loses value when the exit is difficult.
6. Ripple XRP, regulatory catalyst swings with clear technical setups
XRP is best understood as a headline-sensitive range and breakout asset. Regulatory developments can change sentiment quickly, so the technical setup must be paired with an event calendar. Traders who ignore the news risk shorting a breakout or buying a rejection after the market has already priced in the headline.
The post-catalyst screen is straightforward: RSI above 50, a Breakaway pattern, and volume above its average on the daily chart. The purpose is to avoid buying the first headline candle. Waiting for price to establish direction, then checking whether volume remains high, can reduce the chance of treating a temporary spike as a durable trend.
The supplied July 2023 example describes a Breakaway pattern near $0.58 after a favorable SEC ruling and a move toward $0.77 over 12 trading days. An April 2024 illustration describes a Bullish Engulfing candle near $0.52 and a move toward $0.60 over eight days. These are historical examples supplied for chart interpretation, not forecasts or guarantees.
Plan the event window before entering
Mark the relevant regulatory date, then define what would invalidate the trade if the announcement is delayed, ambiguous, or already priced in. A Doji or Hammer near a support band can provide a reversal entry, but the stop still belongs beyond the structure that supports the thesis. If the trade depends on a legal headline, reduce the assumption that technical levels will hold perfectly during the announcement.
Liquidity deserves special attention after news. CoinMarketCap's liquidation dashboard records the largest single-day crypto liquidation at $19.16 billion on October 10, 2025, with earlier spikes of $9.94 billion on April 18, 2021 and $9.01 billion on May 19, 2021. The liquidation data reference shows why headline-driven derivatives activity can accelerate both momentum and reversal setups. For XRP, that means traders should define the exit before the headline arrives.
7. Cardano ADA, deliberate development cycles
Cardano is suited to traders who prefer planned catalyst windows and slower technical development. Its roadmap and improvement proposals can give a trader time to identify a compression pattern before an expected update. That advance notice doesn't eliminate risk. It can also encourage crowded positioning, especially when the market begins moving before the event itself.
A pre-catalyst ADA scan can use Symmetrical Triangle, ADX below 20, and RSI between 40 and 60 on the daily chart. Low ADX suggests compression, while the neutral RSI range avoids entering after an already extended impulse. The key decision comes when price exits the triangle. A breakout without volume confirmation is less useful than one that closes beyond resistance and holds the retest.
Work backward from the roadmap
Use Cardano's official roadmap to identify scheduled development milestones, then inspect the chart for compression before the event. The supplied February 2024 illustration describes a Symmetrical Triangle from January 20 to February 5 and a 14% breakout after a Plutus V3 announcement. A November 2023 example describes a triangle before an Ouroboros upgrade and an 18% move from $0.65 to $0.77 over 10 days after the hard fork.
Those examples are historical illustrations, not evidence that every roadmap event creates a profitable trade. The most important risk is expectation failure. If price breaks down from the triangle, the event thesis has lost technical confirmation, even if the development remains positive.
Watch for profit-taking after a strong post-event move. A high RSI can signal that the original catalyst has been absorbed, but it shouldn't be used in isolation. Confirm whether price has lost a prior higher low, whether volume is declining, and whether the broader market is rotating into another sector.
8. Polkadot DOT, the multi-chain catalyst swing
Polkadot gives traders a cross-ecosystem swing thesis. Its chart can respond to developments on the main network as well as activity connected to parachains and related applications. That creates more than one potential catalyst source, but it also makes the narrative harder to isolate. A DOT setup should identify which event is expected to move price and whether the chart has already reacted.
A practical filter can combine MACD direction, ADX trend strength, and a breakout or retest pattern on the daily or 4-hour chart. Then compare DOT's volume with the volume of the relevant ecosystem tokens. Relative strength is useful only when the comparison is defined. If DOT rises while connected assets remain weak, the move may be driven by a single headline and may need tighter trade management.
Multi-chain flow can create false confidence
The supplied brief frames DOT around 8% to 16% swings over 4 to 10 days, but those figures are planning inputs rather than independently verified market data in the provided sources. Use them as a reminder to examine the holding period and risk before entering, not as an expected range.
A clean example would be a breakout above a multi-day range, followed by a retest that holds while volume remains firm. A failed retest is a direct invalidation signal. Traders shouldn't average down just because another parachain announces an update. The relevant question is whether DOT itself has accepted the new price area.
Execution can become difficult when attention fragments across several ecosystem narratives. Screen DOT first, inspect its own market depth and volume, then use related-chain news only as context. A technically strong DOT chart with weak participation is less attractive than a less dramatic chart with sustained liquidity.
Top 8 Cryptos: Swing Trading Comparison
| Asset | 🔄 Implementation Complexity | Resource Requirements | ⚡ Speed / Efficiency | 📊 Expected Outcomes | ⭐ Key Advantages / 💡 Ideal Use Cases |
|---|---|---|---|---|---|
| Bitcoin (BTC) – The Foundation | Low–Medium: straightforward 4H/daily setups, macro-aware | Very high liquidity; 24/7 exchange + macro & on‑chain data | Moderate: multi-day to multi‑week swings | 5–15% moves over 5–21 days | ⭐⭐⭐⭐ Deep liquidity & repeatable patterns. Ideal for conservative swing entries using RSI <40 + MACD cross. |
| Ethereum (ETH) – Altcoin Proxy | Medium: pattern recognition + catalyst tracking | High liquidity; monitor network upgrades, DeFi metrics | Faster than BTC: pronounced percentage moves | 8–20% over 5–15 days | ⭐⭐⭐⭐ Volatility premium and upgrade-driven swings. Best for larger swing targets around EIPs/Layer‑2 news. |
| Solana (SOL) – High‑Velocity Candidate | Medium–High: fast setups; higher tail risks (network) | Moderate liquidity; ecosystem calendar + validator health | Very fast: intraday → 3‑day swings common | 10–25% moves in 1–8 days | ⭐⭐⭐ High momentum; ideal for short multi‑day swings on ecosystem catalysts but watch outages. |
| Polygon (MATIC) – Layer‑2 Play | Medium: dual-sentiment (ETH + Polygon) | Moderate liquidity; track ETH gas, roadmap events | Moderate: 5–12 day swing windows | 8–15% over 5–12 days | ⭐⭐⭐ Predictable volatility tied to ETH gas and zkEVM roadmaps. Good for pre/post upgrade swing themes. |
| Chainlink (LINK) – Oracle Utility | Medium: data-driven setups linked to DeFi activity | Moderate–High liquidity; track DeFi TVL & integrations | Moderate: 5–10 day moves | 8–18% over 5–10 days | ⭐⭐⭐ Utility‑backed swings with measurable catalysts. Use when DeFi TVL or integrations accelerate. |
| Ripple (XRP) – Regulatory Catalyst | Medium: catalyst-timed trading around legal events | Moderate liquidity; monitor regulatory calendars & headlines | Moderate: 5–12 day catalyst windows | 10–20% post-catalyst over 5–12 days | ⭐⭐⭐ High reward when regulatory news is positive. Best for event-driven swing trades with tight risk control. |
| Cardano (ADA) – Deliberate Cycles | Low–Medium: scheduled roadmap setups (triangles) | Moderate liquidity; follow roadmap, staking metrics | Slower: 2–4 week themed swings | 12–20% around milestones over 2–4 weeks | ⭐⭐⭐ Predictable pre‑fork windows; suited to traders who plan positions ahead of announced upgrades. |
| Polkadot (DOT) – Multi‑Chain Catalyst | Medium: multi-cause setups (parachains + governance) | Moderate liquidity; monitor parachain auctions & gov votes | Moderate: 4–10 day micro-cycles | 8–16% over 4–10 days | ⭐⭐⭐ Frequent, calendared catalysts; ideal for trading cross‑ecosystem events and parachain outcomes. |
Turn the shortlist into a rules-based watchlist
The eight assets serve different trading jobs. BTC is the foundation for liquidity and cleaner execution. ETH offers established altcoin movement with recognizable structures. SOL suits faster momentum traders who can manage sharper reversals. MATIC and LINK are ecosystem-driven candidates, where technical confirmation should follow a specific development or adoption narrative. XRP is most distinctive around regulatory catalysts. ADA fits scheduled development cycles, while DOT offers multi-chain event flow that requires more careful attribution.
The strongest shortlist isn't a permanent ranking. CoinGecko reported average daily trading volume of $155.0 billion in Q3 2025, up 43.8% from Q2, while total 2025 trading volume reached $86.2 trillion, up 47.4% from 2024, in its 2025 Q3 crypto report. TRM Labs also reported that retail transactions rose by more than 125% year over year across comparable January to September periods in 2025, while CoinDesk reported retail broker volume rose 21% as retail investors shifted toward newer, more speculative tokens. Those changes make static “top coin” lists less reliable than a watchlist that responds to current rotation.
Start by choosing the timeframe and risk structure. A multi-timeframe approach can use the weekly chart for macro direction, the daily chart for the swing pattern, the 4-hour chart for entry timing, and the 1-hour chart to refine the stop, as described in this multi-timeframe crypto swing-trading guide. The sequence prevents a bullish 4-hour candle from overriding a clearly bearish higher-timeframe structure.
A practical GeckoScreener workflow
Use currently available GeckoScreener filters in a fixed order:
- Choose the market: Start with BTC and ETH, then add the most liquid altcoins that show a specific catalyst or breakout.
- Define the pattern: Screen for structures such as Hammer, Engulfing, Doji, Morning Star, Pennant, Triangle, or Breakaway.
- Confirm momentum: Add RSI, MACD, ADX, EMA, volume, and price-action conditions that match the setup.
- Inspect the chart image: Check whether the pattern forms at support, resistance, a retest, or the middle of an untradeable range.
- Set invalidation: Decide where the thesis fails before calculating the position size.
- Check execution: Review volume concentration, spread, and the time of day before entering.
A breakout-and-retest example makes the logic concrete. One published setup describes resistance at $50, a retest at $48, an entry at $48.50, a stop at $46.50, and a target at $54.50. The breakout example is useful because it defines the entry, invalidation, and objective instead of describing a breakout vaguely.
Backtesting is the next validation step, but it isn't available in GeckoScreener yet. The platform's backtesting waitlist is collecting user interest, and traders shouldn't present future testing functionality as live. Once available, a proper test should cover both bear and bull market conditions and evaluate Sharpe ratio, maximum drawdown, and drawdown duration, consistent with CoinGecko's backtesting guide. Indicator settings should also be explicit. Option Alpha lists common defaults including RSI(14), MACD(12,26,9), ADX(14), CCI(20), Momentum(10), Stoch(14,3,3), and Stoch RSI(14,14,3,3) in its technical-indicator backtesting reference.
Don't treat any historical example in this article as a performance promise. A chart can show that a pattern preceded a move, but it can't guarantee the same catalyst, liquidity, or market regime will exist next time. Screen the setup, inspect the context, confirm volume, define the invalidation, and size the position before entry.
GeckoScreener currently helps you scan 100+ cryptocurrencies using RSI, MACD, ADX, EMA, volume, price action, and candlestick-pattern filters. Build a focused swing-trading watchlist from the eight assets above, then join the backtesting waitlist to express interest in testing these rules when that feature is live. Visit GeckoScreener to start screening current setups.
GeckoScreener Team
Written for the GeckoScreener community. Join us on Telegram →
Related Articles


Start screening cryptocurrencies for free
Apply strategies like this one in real-time across 250+ coins.
Try GeckoScreener →