Swing Failure Pattern: A Crypto Reversal Guide for 2026
Master the swing failure pattern in crypto trading. Learn identification rules, chart examples, and entry/exit strategies for this reversal setup.
GeckoScreener Team
Jul 31, 2026 · 13 min read
Updated about 1 month ago
Most traders get breakout logic backward. A push above resistance or below support is not automatically strength, and in crypto it's often the market's way of collecting liquidity before reversing hard. The swing failure pattern matters because it shows you where the breakout crowd got trapped, not just where price made a new extreme.
That distinction changes how you read a chart. Instead of chasing every fresh high or low, you start asking whether the move held, whether the wick was a stop run, and whether the close reclaimed the level. In practice, that's where the cleaner reversals tend to live.
Table of Contents
- Why Most Breakouts Fail and What That Means for Traders
- Anatomy of the Swing Failure Pattern
- Backtested Performance Across Market Conditions
- Chart Examples of Swing Failure Patterns in Crypto
- Entry Rules and Risk Management for SFP Trades
- Screening and Backtesting SFPs with GeckoScreener
- Common Mistakes and How to Avoid Them
Why Most Breakouts Fail and What That Means for Traders
A breakout only matters if it holds. Price can trade above a prior swing high or below a prior swing low, trigger every stop clustered there, and still fail to keep going. That's the core logic behind the swing failure pattern, and it's why breakout traders often feel like they were right on direction but wrong on timing.
The best way to think about it is simple. The market reaches for obvious liquidity, fills orders into that move, and then snaps back when the breakout lacks follow-through. Some trading guides describe that sequence as a liquidity sweep or stop run, because the move beyond the level often serves a purpose before the reversal starts.
That's also why the pattern can feel deceptively “obvious” in hindsight. You only get a valid SFP after the market proves it can't sustain the excursion. If you buy the initial break, you're often buying into the trap.
Practical rule: the wick tells you where liquidity was taken, but the close tells you whether the move was accepted or rejected.
That's the part many traders skip. They see a high being broken, assume continuation, and ignore the close back inside the range. In a clean bearish SFP, price probes above resistance, fails to hold, and closes back below the swing point. In a bullish SFP, it does the mirror image below support.
The liquidity-hunt framework is useful because it explains who benefits first. Stop orders above highs or below lows create the fuel for the move, and the reversal often happens after those orders are triggered. That doesn't make every failed breakout tradable, but it does explain why SFPs tend to form around visible swing points, session extremes, and other obvious pools of resting orders.
Anatomy of the Swing Failure Pattern
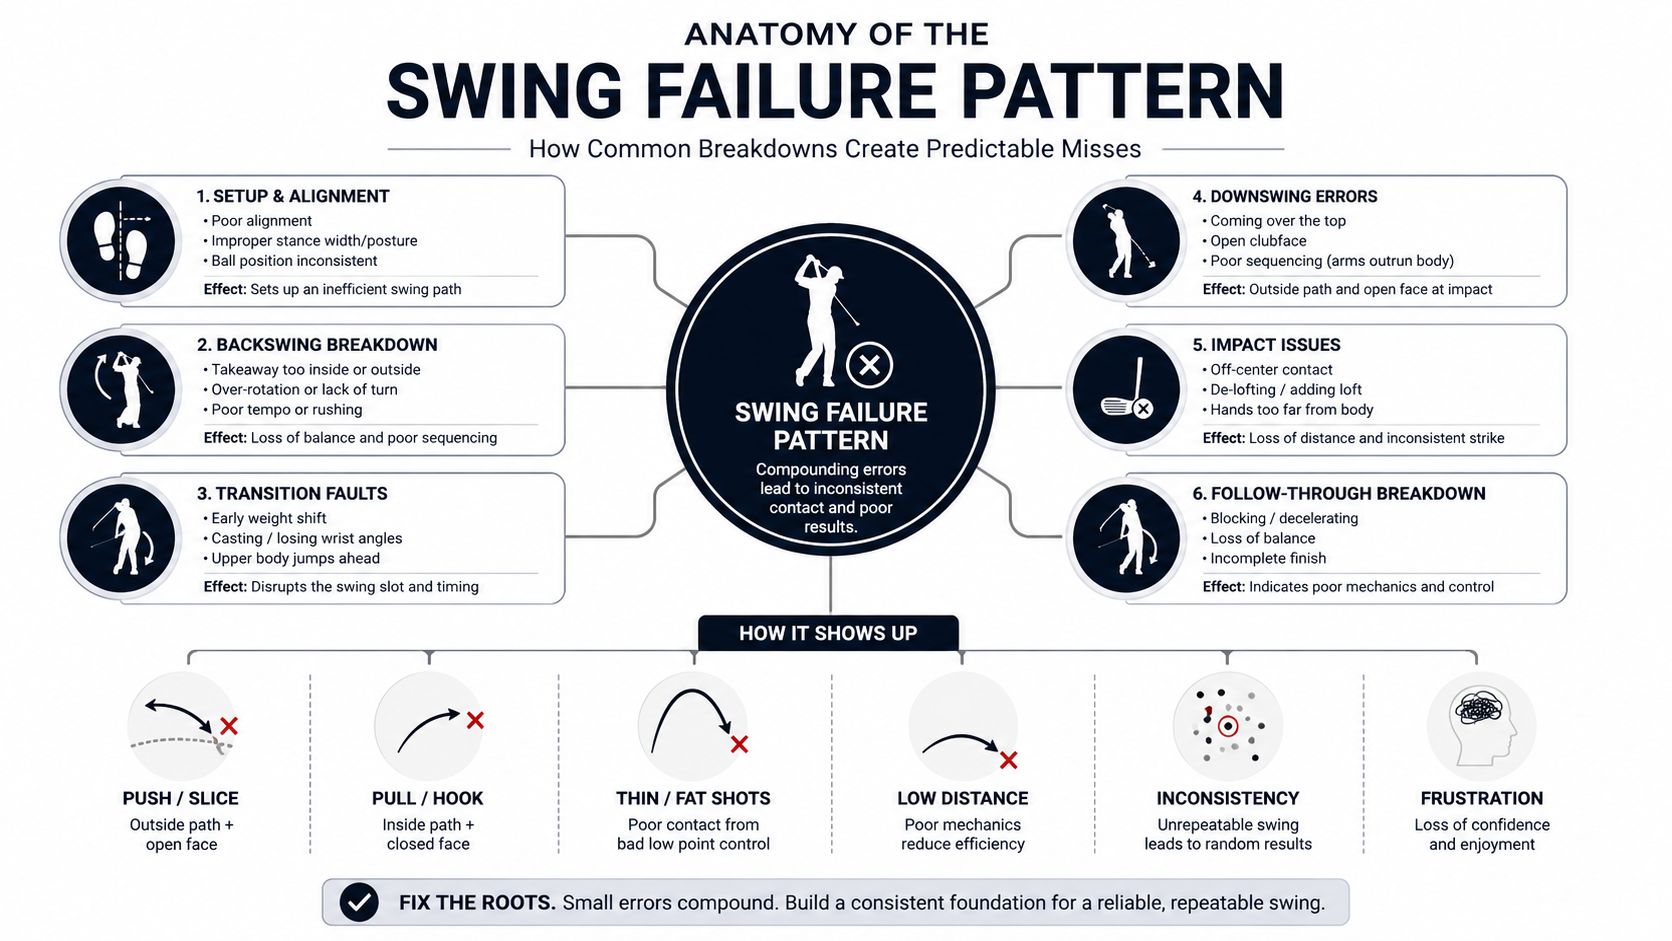
A valid bearish swing failure pattern has three parts. First, price sweeps above a prior swing high. Second, that move fails to hold. Third, the candle closes back below the swing high. If the body closes above the level, it's not an SFP anymore, it's a breakout attempt that held.
Bearish setup rules
The wick above the swing high is the key detail. It shows price reached for liquidity, but the close back under the level shows rejection. That's why a long upper wick matters more than a simple intrabar pierce, because the wick is the evidence of failed acceptance at the new high.
A bullish SFP is the mirror image. Price sweeps below a prior swing low, fails to sustain the breakdown, and closes back above the low. One trading guide explicitly notes that traders often wait for the candle to close before entering long, which makes sense, because the close is what confirms the reclaim.
What confirms the move
Momentum tools can strengthen the read when they disagree with price. RSI or MACD divergence is especially useful when price makes a fresh extreme but momentum does not. That kind of mismatch doesn't guarantee a reversal, but it helps separate a genuine sweep from a messy continuation move.
A strong SFP is usually a failed auction into a well-known level, not just a random candle with a wick.
Context matters as much as candle shape. Higher-quality setups tend to appear at obvious liquidity pools, prior highs or lows, session extremes, or nearby technical zones where many traders cluster orders. If price sweeps a level in the middle of nowhere, the setup is weaker because there's less obvious liquidity to hunt.
The cleanest rule is also the most unforgiving. If the candle body closes beyond the swing point, you don't have an SFP. You have a breakout, or at least a market that hasn't rejected the level yet. That distinction is what keeps the pattern from turning into a vague excuse for trading every sharp reversal.
Backtested Performance Across Market Conditions
The historical edge in SFPs is real, but only in the right context. A crypto backtest covering 2,847 SFP setups across BTC, ETH, SOL, and major altcoins from January 2022 to December 2025 reported an overall 68% win rate and a 1.92 profit factor when the setup was paired with volume confirmation and appropriate risk management. The sample was nearly balanced, with 1,423 bullish and 1,424 bearish setups, which matters because it suggests the edge wasn't limited to one trade direction. GeckoScreener's backtesting guide is a useful companion if you want to test your own rule set against the same kind of workflow.
| Condition | Win Rate | Profit Factor | Avg Holding Period |
|---|---|---|---|
| Overall crypto sample | 68% | 1.92 | Not specified |
| Ranging or consolidation | 74% | 2.31 | Not specified |
| Strong trends | 52% | 1.18 | Not specified |
| Daily setups | 73% | Not specified | 5 to 20 days |
The most important number in that table isn't the overall win rate. It's the spread between regimes. In ranging or consolidation conditions, the same pattern performed materially better, with a 74% win rate and 2.31 profit factor. In strong trends, performance dropped to 52% win rate and 1.18 profit factor, which is the clearest warning sign for traders who keep shorting every bearish wick in a runaway market.
Timeframe also changed the quality of the setup. Daily SFPs showed a 73% win rate with an average holding period of 5 to 20 days, which tells you the pattern is not just an intraday scalp tool. It can work as a broader reversal structure when the market has enough room to rotate.
An earlier Nasdaq-based analysis makes the same point from a different angle. It found SFPs on roughly 4% of observed cases over a sample described as 3,700 days, and when the pattern appeared, price retested the middle candle's extreme about 77% of the time and reached the first candle's extreme about 41% of the time, with the more extended target generally in the 40% to 50% range depending on timeframe. That's a reminder that the setup is uncommon, but when it appears in the right regime, its behavior can be tracked rather than guessed.
Chart Examples of Swing Failure Patterns in Crypto
A bearish crypto SFP usually starts with a level everyone can see. On a Bitcoin chart, that often means a prior swing high, a session high, or a resistance shelf that has already rejected price once before. The sweep candle pushes above that level, prints a long upper wick, and closes back below the high. That close is the whole point, because it shows buyers paid up for the breakout and still couldn't keep the market above resistance.
A Bitcoin resistance sweep
The strongest bearish versions usually happen when the sweep comes after an extended push into resistance. Volume often expands into the wick, then fades after the close back inside the range. That combination suggests the market used the breakout attempt to harvest liquidity, then rotated once the fuel was spent.
The tradeable story is cleaner when the next candle fails to recover the swept high. At that point, traders who bought the breakout are under pressure, stop orders stack above the wick, and the market often moves back toward the nearest support or prior balance area. The earlier section's backtest numbers fit that structure well, because this is exactly the kind of environment where failed auctions can convert into stronger reversals.
A bullish example on Ethereum looks different but follows the same logic. Price trades below a swing low during consolidation, takes the stops under that low, then reclaims the level by closing back above it. If RSI makes a higher low while price makes a lower low, that divergence strengthens the case that downside momentum is fading.
The best SFPs don't appear in empty space. They show up where the chart already made traders care about the level.
That's why prior session highs and lows matter so much, along with major swing points and obvious range edges. If the sweep happens at a level where many traders already had orders parked, the reversal has more fuel. If it happens in the middle of a trendless chop with no clear liquidity pool, the signal tends to be noisy rather than useful.
Entry Rules and Risk Management for SFP Trades
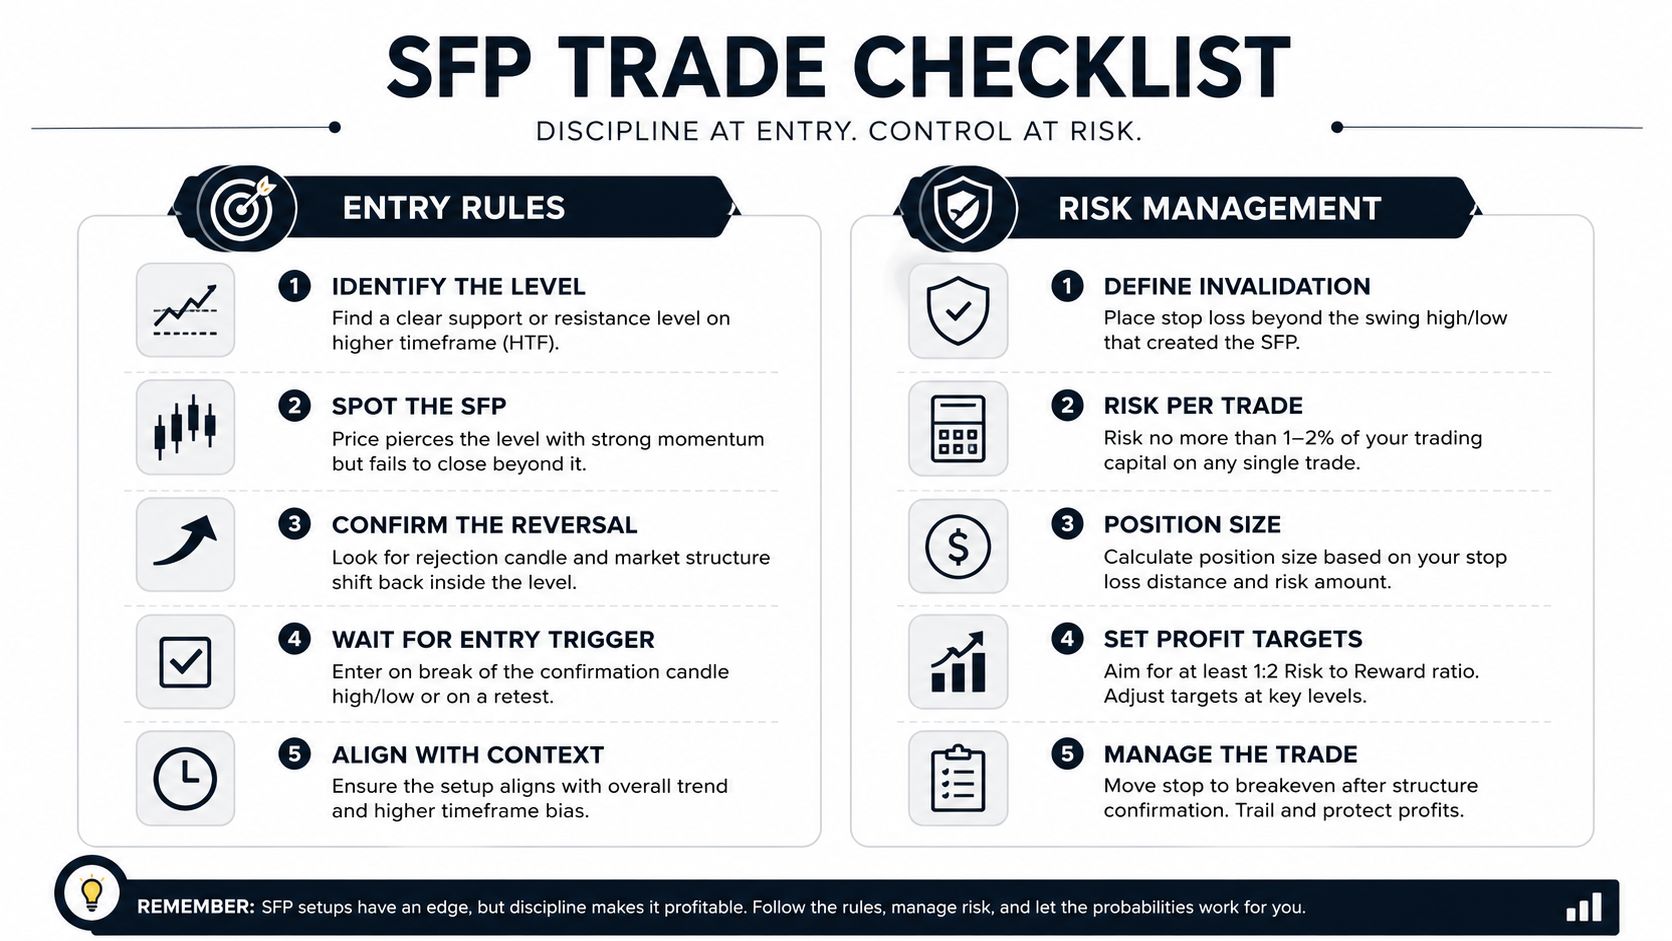
The cleanest entry rule is also the least exciting one. Wait for the sweep candle to close before taking the trade, because the close is what confirms that the level failed to hold. A bearish setup should close back below the swept high, and a bullish setup should close back above the swept low.
Entry and stop placement
A practical entry can come on the reclaim of the failed level or on a retest of the sweep area. Some traders add if price revisits the level after confirmation, but that only makes sense if the reclaim still looks clean. The worst habit is entering before the candle closes, because that turns a defined pattern into a guess.
Stops belong beyond the wick. For bearish setups, that means above the wick high. For bullish setups, it means below the wick low. Some guides frame that placement as protecting against the exact extreme of the liquidity grab, which is the right logic because any move beyond that point means the failed breakout thesis is no longer intact.
Targets and trade management
The Nasdaq-based example gives useful target expectations. Price retested the middle candle's extreme about 77% of the time, and reached the first candle's extreme about 41% of the time. In practice, that makes partial exits at nearby structure sensible, with a deeper target left for the cleaner trends.
This stop-loss guide is worth reading if you want a tighter framework for defining invalidation. The broad principle is straightforward, though, keep risk sized for the regime. A range-bound SFP with strong confirmation can justify more confidence than a weak one inside a persistent trend, but no setup deserves oversized risk just because it looks clean on one candle.
Screening and Backtesting SFPs with GeckoScreener
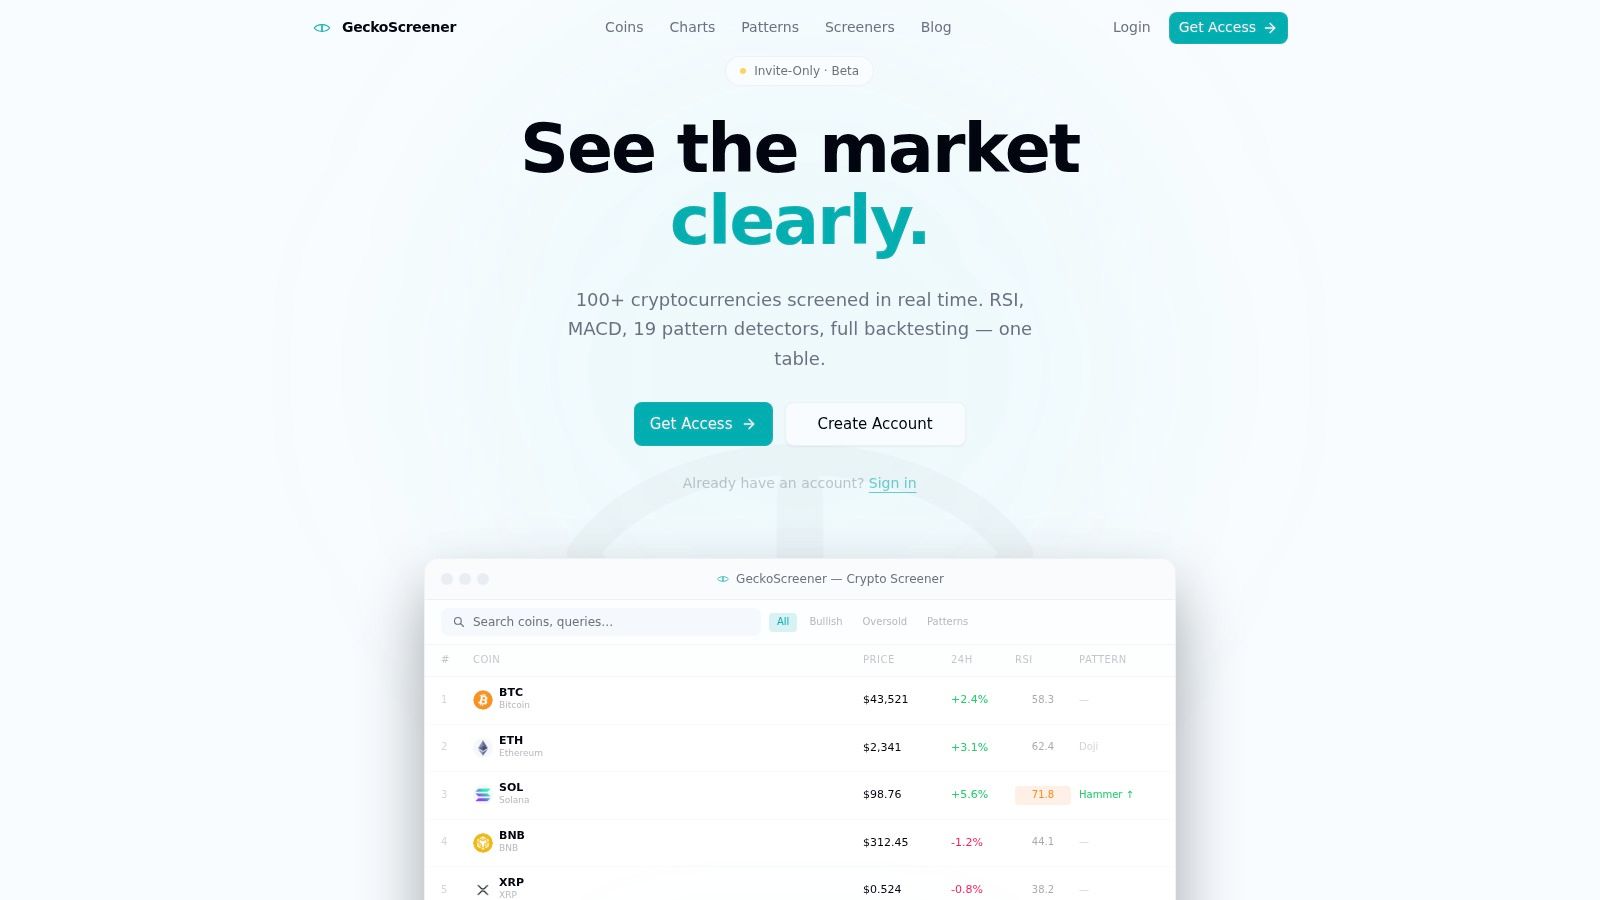
Manual chart scanning catches good setups, but it's slow and inconsistent. The cleaner approach is to screen for the ingredients that usually accompany a valid swing failure pattern, then test them across a broad crypto universe before risking capital. That matters because SFPs are context tools, not standalone candles.
From chart reading to rule-based filtering
A systematic workflow starts with liquidity-aware conditions. You can filter for assets showing relevant candlestick behavior, then narrow the list with indicator context such as RSI, MACD, and volume. That combination is useful because the pattern itself is a price structure, but the confirmation often comes from how momentum and participation behave around the sweep.
A plain-language strategy builder is especially helpful for translating the setup into rules without coding. Instead of saying “find an SFP,” you define the actual conditions, the sweep, the close back inside the range, and the indicator filters that separate rejection from noise. That gives you a repeatable screen rather than a subjective chart hunt.
Backtesting across multiple coins
The same workflow becomes more useful when you test it across multiple assets at once. Portfolio-mode evaluation helps you see whether the pattern behaves consistently across different coins or whether it only works in a narrow subset of names. Equity curves and trade histories matter here because they show whether the edge survives contact with real market variation.
GeckoScreener's complete guide is the place to start if you want to build this into a routine instead of a one-off experiment. The value isn't just speed, it's consistency. Once you define the exact SFP logic you trust, you can keep applying it across the top crypto names without rebuilding the process every time.
Common Mistakes and How to Avoid Them
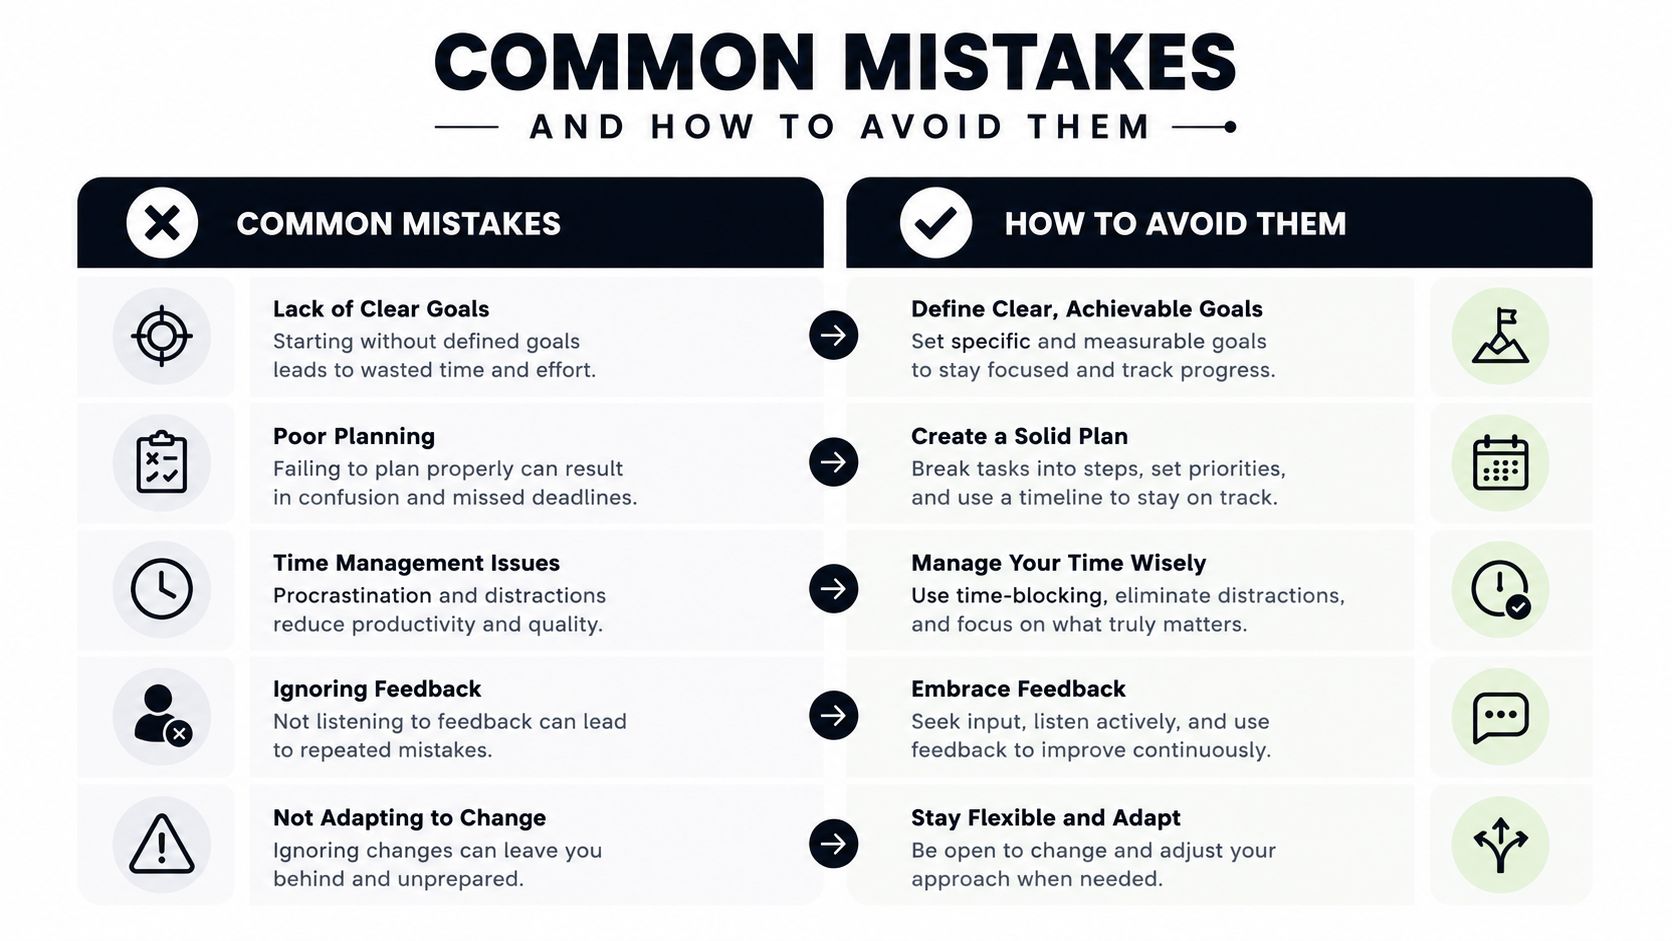
The biggest SFP mistake is trading it like a universal reversal button. It isn't one. The backtested crypto data already showed why, performance was strongest in ranging or consolidation conditions and materially weaker in strong trends, so fading every sweep in a runaway market is a fast way to get chopped up.
The errors that usually cost traders
Entering before confirmation is another avoidable error. If the candle hasn't closed back inside the range, you don't know yet whether the level failed or just paused. The wick can be the first clue, but the close is what turns the setup into a tradeable SFP.
Ignoring confirmation filters is the third problem. Momentum divergence or volume behavior won't rescue every weak setup, but they do help separate a true liquidity grab from random volatility. Traders who skip that filter usually end up taking the noisiest versions of the pattern, especially on lower-quality timeframes.
A simple discipline set keeps the setup usable:
- Wait for the close. The pattern is not confirmed until price closes back inside the prior range.
- Trade at obvious liquidity pools. Prior highs, prior lows, and session extremes are better than random intraday bumps.
- Place stops beyond the wick. That wick marks the extreme of the failed auction.
- Respect the regime. Range conditions have historically been more favorable than strong trends.
- Keep size proportional. One clean pattern can still fail, even when the structure looks textbook.
The swing failure pattern works best as one part of a broader process. Used that way, it helps you avoid chasing breakouts into trapped liquidity and gives you a clearer read on where the market is likely to reject. Used alone, without context or confirmation, it turns into just another candle pattern with a nice story attached.
If you want to scan SFP-like setups faster, test them against volume and momentum filters, and compare how they behave across different coins, start with GeckoScreener. It gives you a structured way to find, filter, and validate the kind of liquidity-driven reversal setups covered here.
GeckoScreener Team
Written for the GeckoScreener community. Join us on Telegram →
Related Articles


Start screening cryptocurrencies for free
Apply strategies like this one in real-time across 250+ coins.
Try GeckoScreener →