Bollinger Bands Crypto Strategy: A Practical Guide
Master the Bollinger Bands crypto strategy with setup tips, entry/exit signals, RSI/MACD combos, and backtesting insights across top coins using GeckoScreener.
GeckoScreener Team
Aug 22, 2026 · 15 min read
Updated about 2 months ago
The popular advice is simple: put Bollinger Bands on a crypto chart, use 20 periods and 2 standard deviations, then buy the lower band or sell the upper band. That recipe is useful as a starting point, but it isn't a universal edge. Recent testing shows that the same Bollinger Band logic can produce a high win rate and still lose money, work on one timeframe while failing on another, and transfer poorly from Bitcoin to other assets.
A practical Bollinger Bands crypto strategy treats the indicator as a volatility framework, not a complete trading system. The bands can help identify compression, extension, trend strength, and possible mean reversion. They can't tell you whether a move will continue, whether fees will erase a small edge, or whether a setting that worked on BTC will survive on ETH, SOL, or AVAX.
Table of Contents
- Why the Default Bollinger Band Setup Fails in Crypto
- Setting Up Bollinger Bands for Crypto Charts
- Reading Entry and Exit Signals From the Bands
- Combining Bollinger Bands With RSI MACD and Candlestick Patterns
- Risk Management Rules for Bollinger Band Trades
- Backtesting Bollinger Band Strategies Across Crypto Assets
Why the Default Bollinger Band Setup Fails in Crypto
Bollinger Bands were created by John Bollinger in the early 1980s and became one of technical analysis's most widely used volatility tools. The conventional setup uses a 20-period simple moving average, with the outer bands positioned two standard deviations above and below that average. That configuration remains a sensible baseline for crypto research because it connects price extremes to recent volatility, a useful relationship in markets with sharp intraday swings. Gate Research describes the canonical 20,2 configuration and its continued use in recent BTC testing.
The mistake is treating the baseline as a finished strategy. A lower-band touch in a quiet range is not the same event as a lower-band touch during a high-volume liquidation cascade. A breakout on a daily chart doesn't carry the same execution problem as a breakout on a five-minute chart. The calculation stays the same, but the market context changes underneath it.
Win rate doesn't tell the whole story
A long-only daily Bitcoin mean-reversion strategy tested from June 22, 2024, to June 22, 2026 produced 14 trades, a 71.4% win rate, and a -0.76% total return. The result is a useful warning. Winning often wasn't enough to overcome losing trades, trade distribution, and the size of individual outcomes. The BTC backtest data is reported by CoinQuant.
Shorter tests looked very different. A 30-minute BTC/USDT mean-reversion test reported 81 trades, a 63.0% win rate, 14.52% total return, and 6.99% maximum drawdown. A 12-hour version reported 26.74% ROI, a 76.9% win rate, and 25.19% maximum drawdown, while a separate 15-minute strategy reported 173 trades, a 71.1% win rate, 8.81% total return, and 10.63% maximum drawdown. Those outcomes don't identify one “correct” timeframe. They show that timeframe, execution assumptions, and volatility regime materially alter the edge.
Practical rule: Treat 20,2 as a research starting point. Never treat it as proof that the same entry rules belong on every coin and chart.
A broader stress test makes the problem harder to ignore. An independent 2026 test examined more than 2,700 Bollinger Band breakout configurations across BTC, ETH, SOL, and AVAX. It found that timeframe choice affected risk more than individual band settings, and that configurations working on one coin often failed on others. The cross-asset stress test is documented on TradingView.
The true edge isn't the band formula. It's knowing when the market is ranging, trending, compressing, or moving too violently for a mean-reversion assumption.
Setting Up Bollinger Bands for Crypto Charts
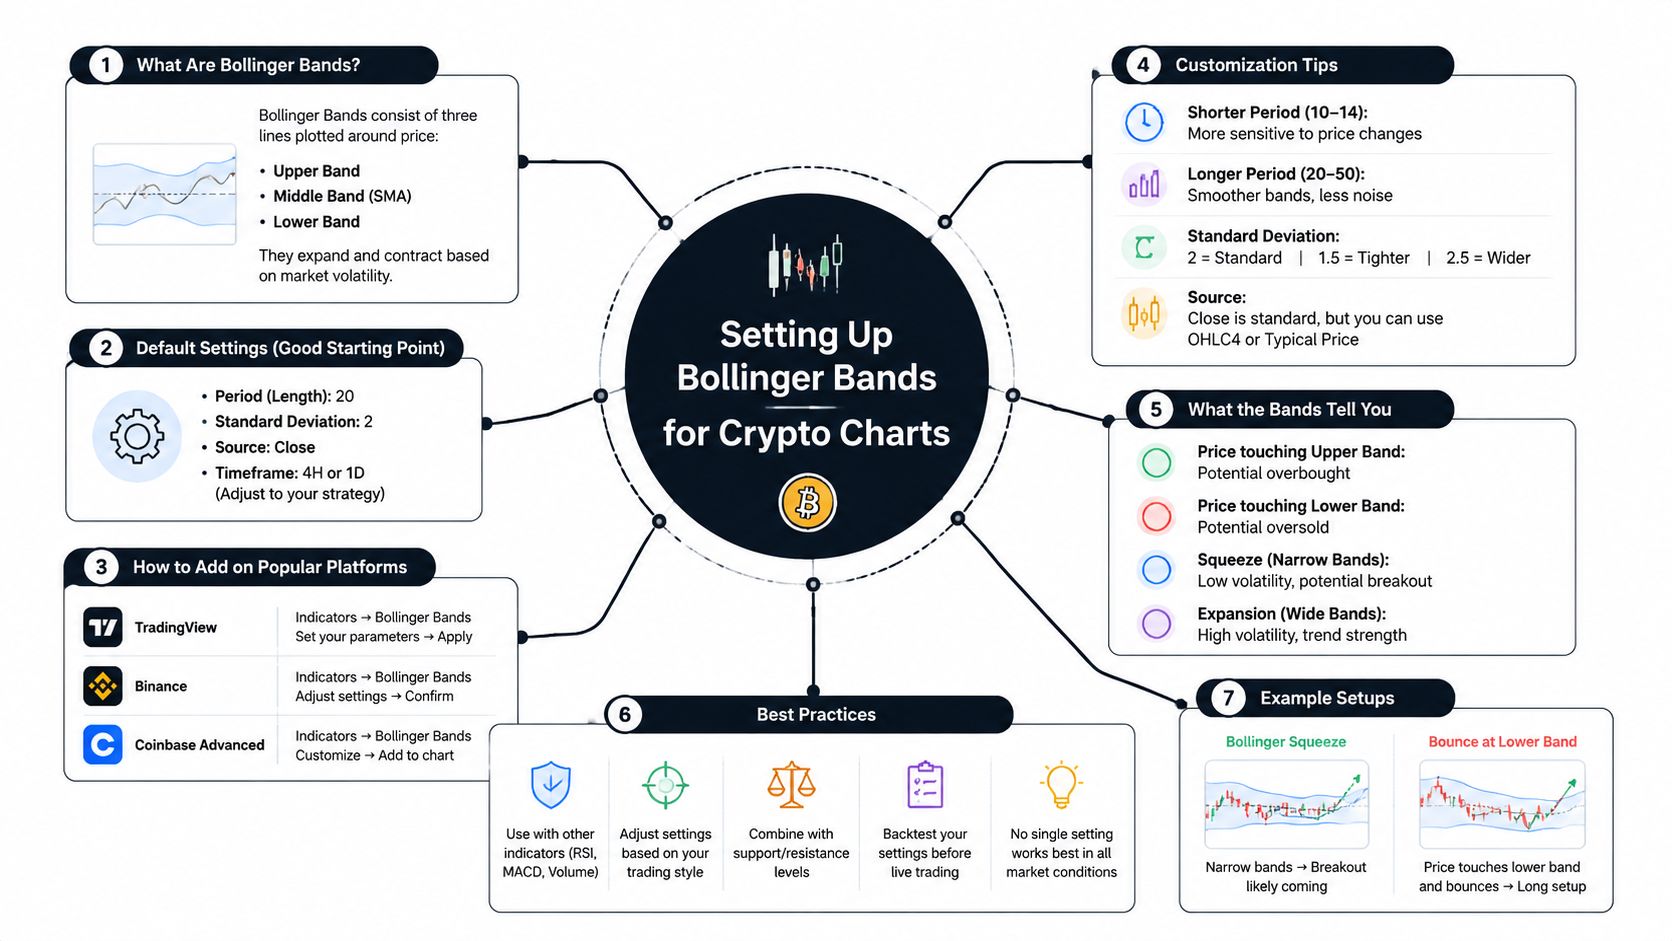
Default settings are a starting point, not a finished strategy. On a clean candlestick chart, select the trading pair, add Bollinger Bands, and verify every input against your test. The standard structure uses a 20-period simple moving average, an upper band at +2 standard deviations, and a lower band at -2 standard deviations. Bitbo provides the standard Bollinger Band formula used in crypto charting.
The middle band serves as your short-term reference price, not a trigger to act on. Price holding above it during pullbacks gives the chart a bullish bias, while sustained trading below it leaves rallies vulnerable to resistance at the average. The outer bands measure price against recent dispersion. A touch marks a statistical extreme within the selected lookback, rather than a reversal signal.
Read the shape before reading the touch
Band width often provides more context than one candle reaching an outer band. Wider bands reflect expanding volatility, while narrower bands show compression inside a tighter recent range. Compression can precede a directional move, although it does not establish direction.
Crypto makes this distinction harder to ignore. A narrow band can produce a clean breakout or several false starts. On BTC, compare the band structure with nearby support, resistance, and candle closes. Tightening bands alone are not an entry. Wait for acceptance beyond a meaningful level, then weigh the possible reward against execution risk.
ETH/USDT shows why timeframe context matters. One charting example places price near the upper band on the 1-hour chart, suggesting bullish short-term sentiment, while price remains below the moving average on the daily chart, creating a bearish medium-term context. The same example presents narrowing bands as a lower-volatility period. Bitsgap illustrates this ETH/USDT contrast across hourly and daily charts.
Use these visual cues as context:
- Above the middle band: Momentum has a bullish tilt, although price may already be extended.
- Below the middle band: Sellers control the recent average until price reclaims it.
- Near the outer band: Price is extended relative to recent volatility, without proving an overbought or oversold condition.
- Narrowing bands: Volatility is compressed. Prepare for movement while keeping direction open.
- Expanding bands: Volatility is rising, which can suit breakout tactics and punish tight stops.
Period, deviation, and price-source choices can be adjusted for different crypto setups. This Bollinger Bands settings guide covers those inputs. Keep changes limited and test them across assets. Repeatedly tuning parameters until a historical chart looks perfect creates rules that are fragile in live markets.
Reading Entry and Exit Signals From the Bands
A band touch is only an observation. A trade needs a condition that can be tested, repeated, and invalidated. Separate signals into mean reversion, squeeze breakout, and trend continuation, because each depends on a different market structure. The default 20,2 setting can make these edges look cleaner than they are, especially on thinner coins or lower timeframes. Validate the setup on the asset and timeframe you intend to trade.
Mean-reversion bounces
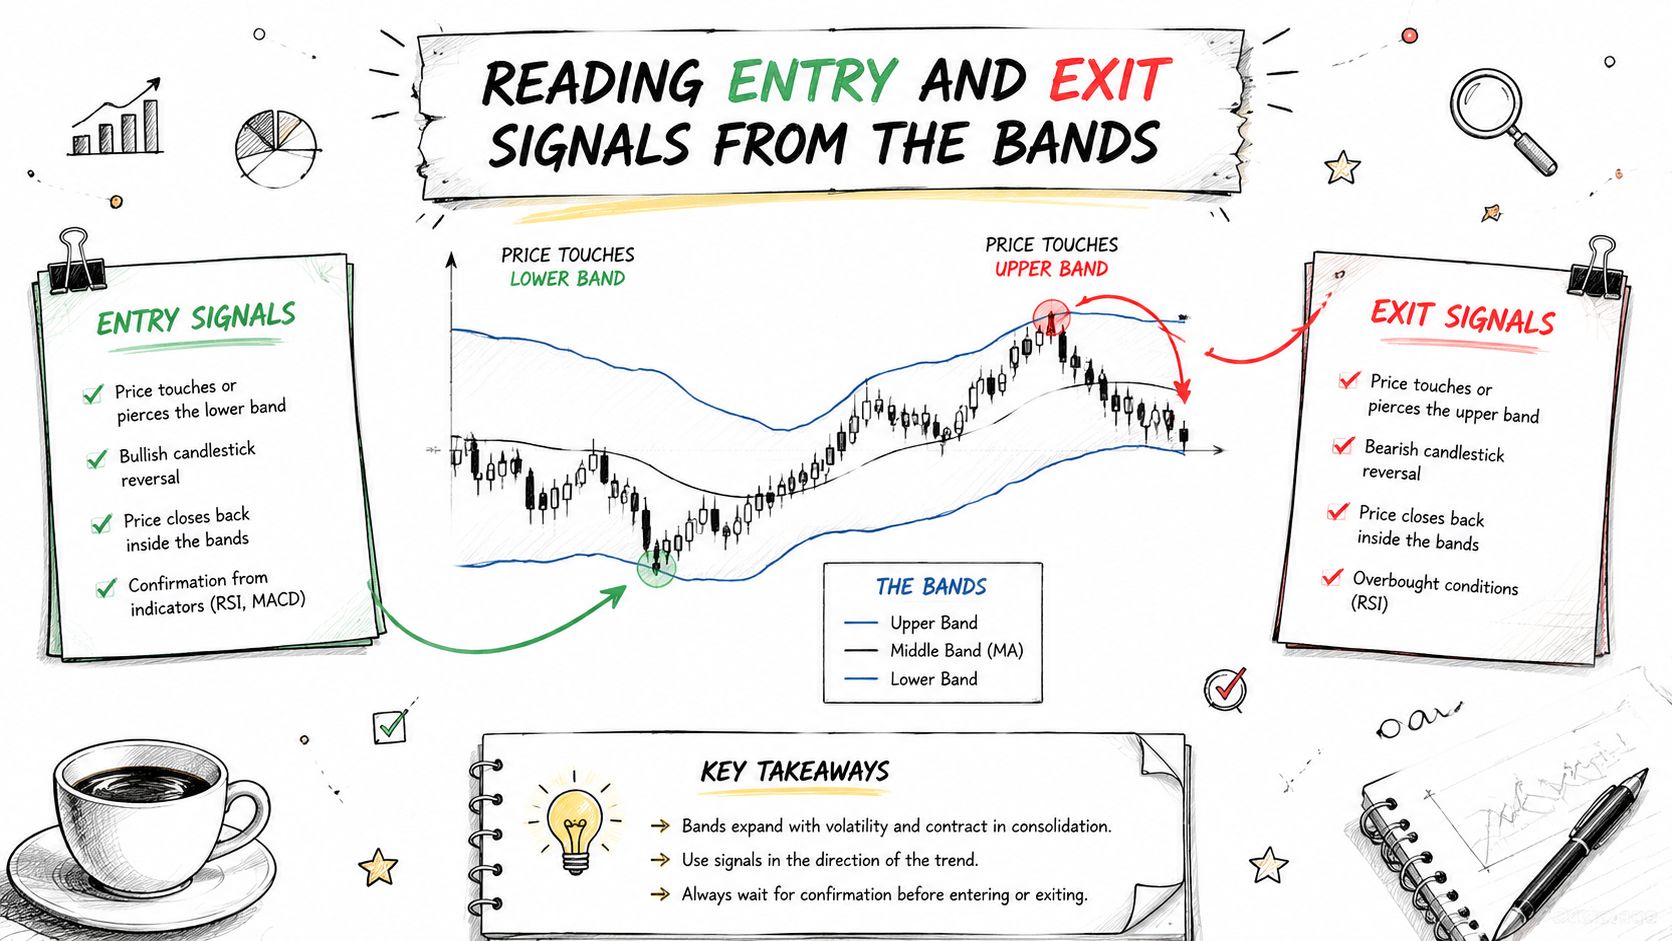
In a range, a move below the lower band can mark temporary extension. The cleaner setup requires the candle to close back inside the band after the initial touch, preferably near established support. Enter after the reclaim, use the middle band as an initial target, and invalidate the trade if price continues lower instead of recovering.
That logic breaks down in a strong downtrend. A coin can stay below the lower band while sellers keep pressing, turning a first-deviation purchase into a falling-knife trade. The upper band creates the same trap during a forceful rally. Price may ride the band for an extended move, so shorting the first upper-band touch places the trade against momentum without reversal confirmation.
Squeeze breakouts
A squeeze forms as the bands contract and volatility falls. Wait for a decisive close outside the compressed structure, then assess volume, market structure, or a retest. The retest helps filter the first move, which can be a liquidity sweep that quickly returns inside the bands.
Compression provides a volatility condition and leaves the next direction unresolved. Define the breakout level before the candle arrives, and require more than a brief wick beyond the band. This matters across crypto assets because a squeeze on a liquid major pair can behave differently from one on an illiquid altcoin, while a five-minute signal can fail much faster than a setup on a higher timeframe.
Trend continuation
In a healthy uptrend, repeated closes near the upper band can show strength rather than exhaustion. A trend trader can wait for a pullback toward the middle band and enter only after buyers defend that reference. In a downtrend, apply the same process to lower-band behavior and rallies into the average.
| Signal | Better context | Common mistake |
|---|---|---|
| Lower-band reclaim | Range support and reversal confirmation | Buying the first touch |
| Upper-band breakout | Compression, structure break, and follow-through | Shorting strength immediately |
| Middle-band pullback | Established directional trend | Treating every average touch as support |
| Band walk | Persistent momentum and orderly pullbacks | Assuming the move must reverse |
Gate Research's BTC/USDT five-minute testing found that a plain mean-reversion setup faced high trading frequency, fee erosion, and false breakouts. Volatility filters, cooldown rules, and band-width selection improved stability, with some parameter combinations reaching a Sharpe ratio near 4.6 in-sample. See the detailed Gate Research announcement for the test conditions and limitations. Treat that result as a parameter-validation example, not live-performance proof. The practical lesson is to test each asset, timeframe, and market regime before relying on a band edge.
Combining Bollinger Bands With RSI MACD and Candlestick Patterns
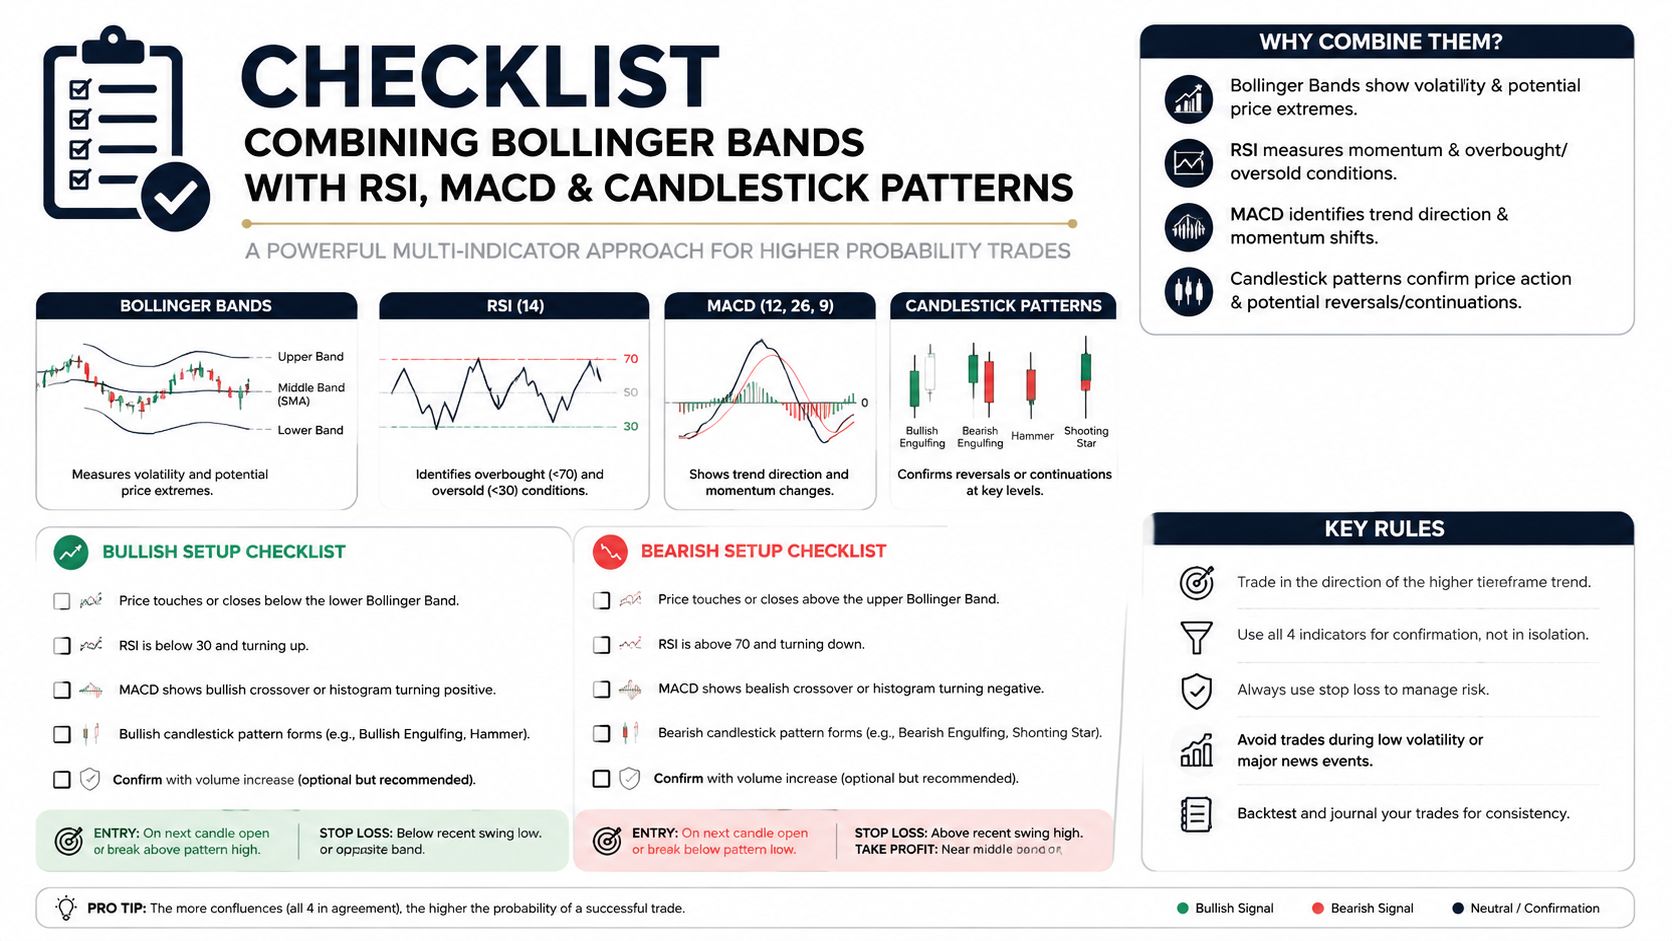
Bollinger Bands show volatility and relative price location. On their own, Bollinger Bands lack the specificity needed to distinguish temporary stretches from genuine trends. Use a compact confirmation stack, with each indicator answering a separate trading question.
RSI asks whether momentum is stretched. In a lower-band mean-reversion setup, require an RSI reading below 30, then wait for a bullish reversal candle to close back inside the bands. This filters impulsive entries, though it cannot validate the trade by itself. RSI can remain weak during a persistent downtrend, so price structure still determines whether a reversal has room to develop. The RSI indicator guide for crypto explains how oscillator readings fit into a broader decision process.
MACD asks whether momentum is turning or continuing. In a range trade, a bullish MACD crossover can support a lower-band reclaim, while a bearish crossover can reinforce an upper-band rejection. During a breakout, MACD works better as a directional filter than as a late entry trigger. Waiting for every crossover often means entering after the useful part of the move.
Candlesticks handle execution. A hammer at the lower band shows rejection, but the setup improves when the candle closes constructively and reclaims the band. A shooting star at the upper band warns of rejection, with greater significance when price also loses the middle band or fails at established resistance.
Use different confirmation for different jobs
A mean-reversion checklist might include:
- Price reaches or briefly breaches the lower band.
- The broader chart shows a range or identifiable support.
- RSI shows an oversold reading, such as below 30.
- A bullish candle closes back inside the bands.
- MACD stops deteriorating or crosses upward.
- The middle band leaves enough room for a sensible exit.
A breakout checklist needs a different filter:
- Compression: Bands narrow relative to the recent chart.
- Location: Price sits near a defined range boundary.
- Close: The breakout candle closes beyond the boundary instead of only wicking through it.
- Follow-through: The next reaction does not immediately erase the move.
- Momentum: MACD and volume, where available, support the direction.
Avoid stacking indicators for reassurance. RSI, MACD, and candlesticks all derive from the same price history, so three signals can describe one underlying event. Each tool then addresses a distinct question rather than overlapping in purpose. Bollinger Bands define the volatility condition, RSI measures stretch, MACD frames momentum, and candlesticks set the execution trigger.
Risk Management Rules for Bollinger Band Trades
A Bollinger Band setup gives you a location. Risk management decides whether that location is worth trading. The stop should sit where the original idea is invalid, not at an arbitrary distance chosen to avoid being stopped.
For a lower-band mean-reversion trade, a stop can sit beyond the recent swing low and outside the band, with enough volatility room to avoid normal noise. For an upper-band rejection, use the equivalent structure above the recent swing high. If price breaks through the level that was supposed to hold and closes with momentum, accept that the setup failed.
Match exits to the strategy
Mean-reversion trades usually need a modest objective. The middle band is a logical first target because it represents the recent average. A trader can then consider the opposite band or a nearby resistance level only if momentum supports a larger move.
Trend trades use a different exit logic. The middle band can become a trailing reference, allowing the position to remain open while price holds the trend structure. A decisive close through the average can be an exit signal, especially when the band begins to flatten and momentum fades.
Breakout trades need room for retests. Placing a stop immediately inside the breakout candle often creates a poor trade because crypto price can revisit the broken level before continuing. The stop belongs beyond the invalidation area, while the position size should shrink when that distance is wider.
Risk rule: Choose the invalidation level first, calculate the position size second, and only then decide whether the trade is attractive.
Before entering, check:
- Market regime: Is this a range, a trend, or an unstable transition?
- Trade type: Are you fading an extension, joining momentum, or trading a breakout?
- Stop location: Does the stop sit beyond a meaningful structural failure?
- Target logic: Is the target based on the middle band, opposite band, or trend exit?
- Execution cost: Will frequent entries and exits make the expected move too small?
- Event risk: Could sudden volatility invalidate the chart structure before an order fills?
Avoid increasing your position size just because the stop looks close. Crypto volatility can expand rapidly, and a narrow stop often reflects wishful thinking rather than controlled risk. Consistent sizing and predefined exits matter more than finding the perfect band touch.
Backtesting Bollinger Band Strategies Across Crypto Assets
Backtesting exposes weaknesses that screenshots conceal. A setup may look clean on BTC daily data yet lose its edge after fees, behave differently intraday, or fail when applied to another coin. As noted earlier, daily BTC testing produced 71.4% wins with -0.76% total return, showing why win rate alone cannot validate a Bollinger Band crypto strategy.
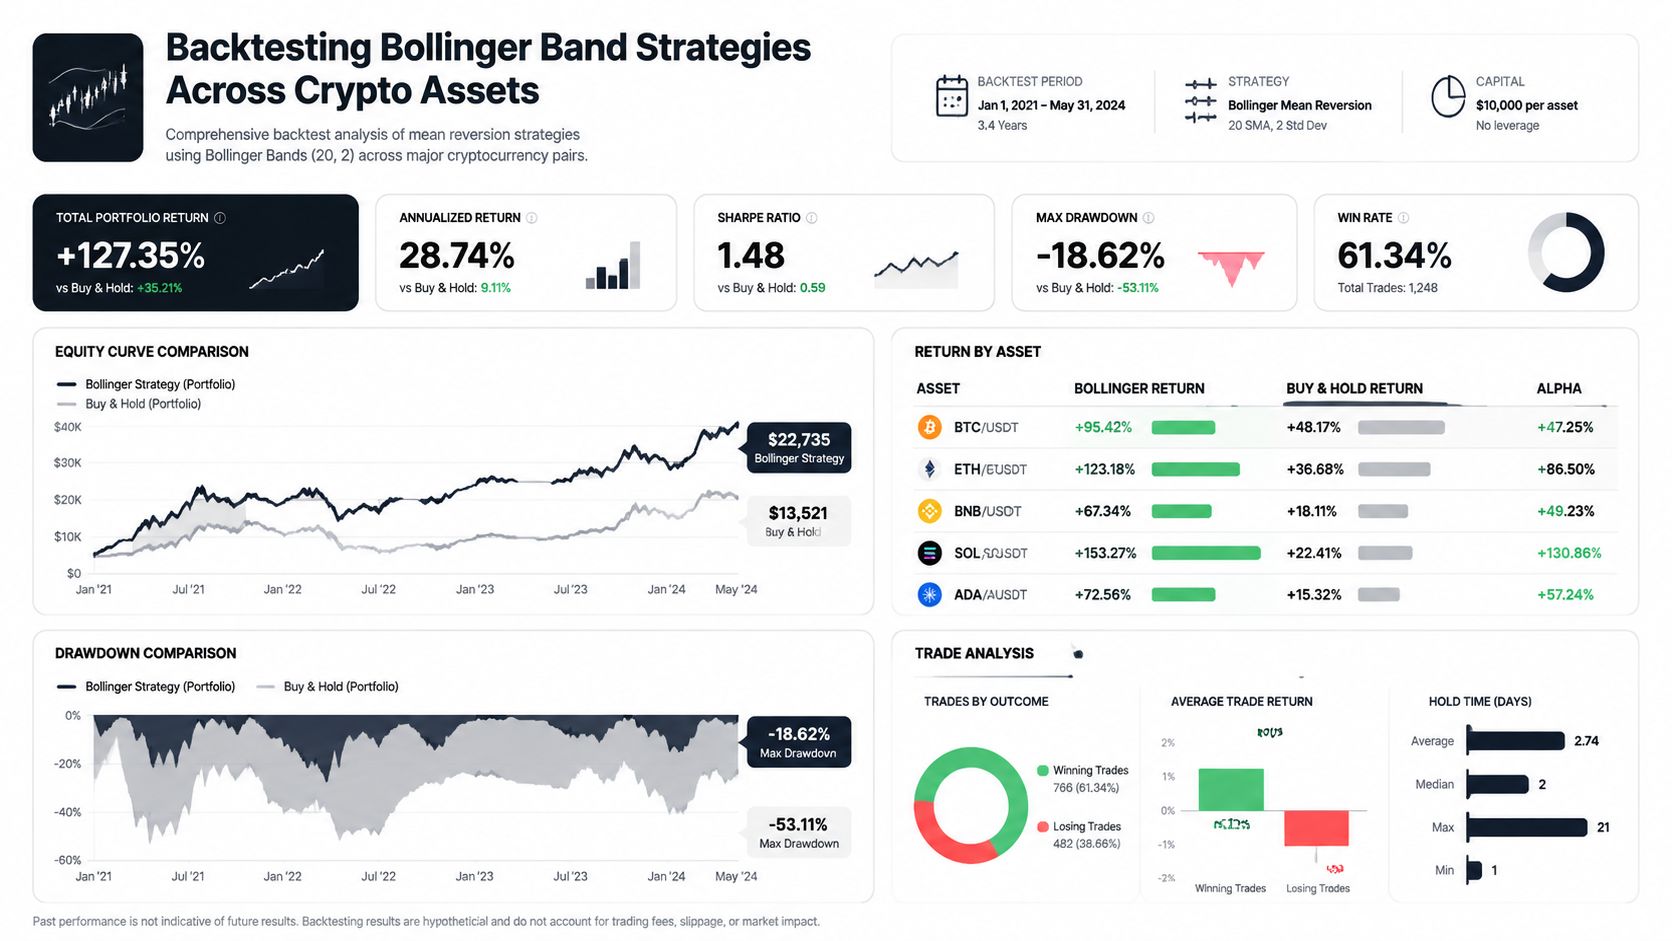
Change one variable at a time. Start with the default 20,2 settings, then compare the entry rule, timeframe, asset, exit method, and filters. Record the following:
- Trade count: Frequent entries increase exposure to fees and execution friction.
- Win rate: Read it alongside average win, average loss, and drawdown.
- Maximum drawdown: Shows the decline the trader must withstand.
- Equity curve: Reveals whether gains come from a repeatable process or a small group of trades.
- Parameter sensitivity: Shows whether a minor setting change destroys the result.
- Cross-asset behavior: Tests whether the setup transfers beyond the coin used during development.
The five-minute BTC/USDT research matters to traders testing squeezes and mean reversion. The plain setup faced frequent trading, fee erosion, and false breakouts, while volatility filters, cooldown rules, and band-width selection improved stability. Some combinations reached a Sharpe ratio near 4.6 in-sample, so unseen-data testing remains necessary. If performance disappears after the test window, the settings captured a past regime rather than a durable edge. Gate Research's Bollinger Band analysis provides the stated test period and filtering comparison.
GeckoScreener can screen crypto assets, combine indicator and candlestick conditions, create plain-language rules without code, and evaluate individual coins or portfolios. Its workflow also includes historical backtesting, trade history, and equity-curve review. Use the same Bollinger Band rules across assets and timeframes instead of trusting one attractive chart. The platform's trading and backtesting features are not available yet, while backtesting and alerts will be live very soon. This guide to backtesting crypto trading strategies offers a practical reference for structuring validation.
A Bollinger Band crypto strategy earns credibility only after it survives different regimes, cost assumptions, timeframe comparisons, and cross-asset tests. The default 20,2 setup is a starting point, not evidence that the edge will hold.
Visit GeckoScreener to screen crypto markets and turn Bollinger Band, RSI, MACD, and candlestick ideas into rules you can validate before risking capital. The platform's backtesting and alerts will be live very soon, making it easier to test whether your setup generalizes beyond a single chart.
GeckoScreener Team
Written for the GeckoScreener community. Join us on Telegram →
Related Articles



Start screening cryptocurrencies for free
Apply strategies like this one in real-time across 250+ coins.
Try GeckoScreener →