Gravestone Doji Candlestick: Rejection at the Highs
What the gravestone doji candlestick signals, what the backtests actually show, and the confirmation rule that separates a real rejection from a noisy wick.
GeckoScreener Team
Apr 1, 2026 · 9 min read
Updated about 1 month ago
Quick Summary
- A gravestone doji opens and closes at (or near) the session low, with a long upper shadow and no lower shadow.
- Buyers drove price up hard and sellers pushed it all the way back, so close equals open equals low.
- At the top of an uptrend: the strongest version. Buyers tried and were rejected outright.
- Near key resistance: high conviction. The level is actively holding.
- At the bottom of a downtrend: ambiguous. Some buying appeared and failed. Treat it cautiously.
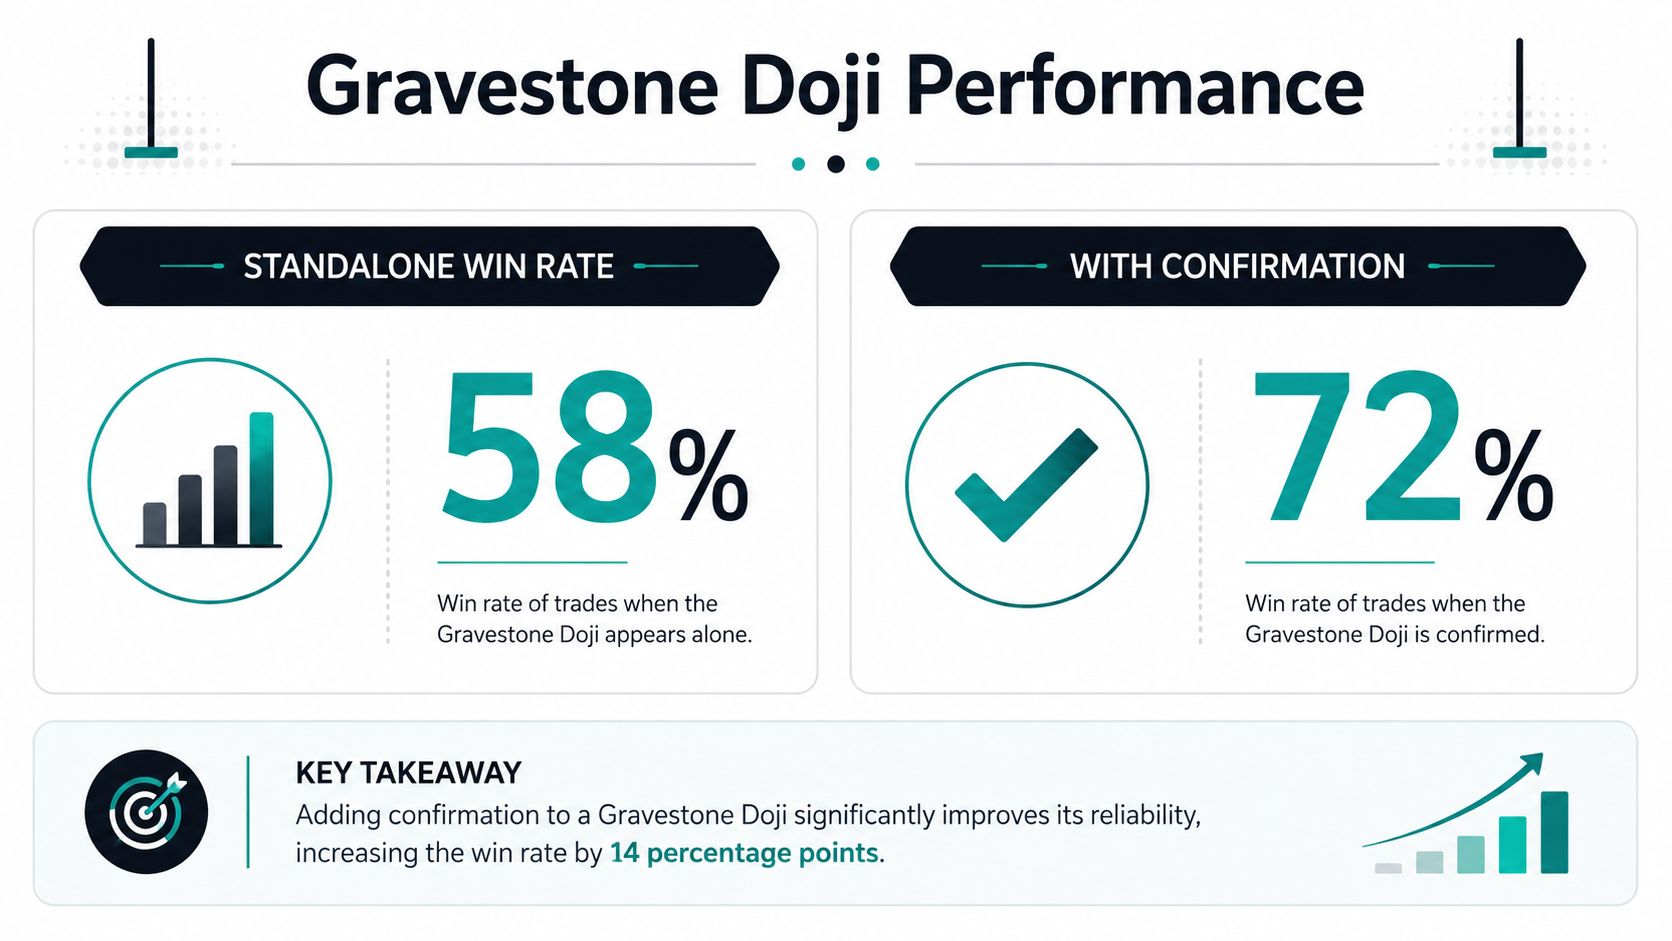
- Historically it reverses lower only about half the time on its own, so confirmation is not optional.
Pattern Anatomy
BearishSignal
BearishStrength
Structure
1 candle · Reversal
Best timeframe
1D · 1W
Key rule
Open = close at session low, long upper wick. Strong rejection of highs.
Buyers drove price higher all session, then sellers erased every bit of it and the candle closed exactly where it opened. That is a gravestone doji candlestick: a complete rejection of the highs, shaped like an inverted "T" with a long upper wick, no lower wick, and the open and close sitting at the session low.
Few candles are as easy to spot, and few get traded as carelessly. Most people treat it as a clean sell trigger, and that is the wrong mental model. A gravestone doji can flag rejection, exhaustion, or nothing at all, and the difference comes down to where it prints and whether the next candle agrees.
Its shape is memorable. Its edge is conditional. In crypto, where long wicks are routine and fakeouts are normal, that distinction matters more than the pattern's name.
Table of contents
- What a Gravestone Doji Candlestick Is
- The Psychology
- What the Data Actually Says
- Where It Appears Decides What It Means
- Build the Setup in Layers
- How to Trade It
- Why Crypto Makes This Harder
- Frequently Asked Questions
- See It Live, Current Gravestone Doji Signals
What a Gravestone Doji Candlestick Is
A gravestone doji is the bearish counterpart to the dragonfly doji. All the session's activity happened above the open and close. Buyers drove price up, sellers sold into every rally, and the candle closed at the very bottom of its range.
Formation rules:
- Open is roughly equal to close, and both sit at the session low
- A long upper shadow, at least two to three times the body
- No lower shadow, or one small enough to ignore
It is closely related to the shooting star, and the two are often confused. Both show rejection of the highs. The shooting star keeps a small but distinguishable body, so open does not equal close. A gravestone doji is stricter still, because the rejection is total.
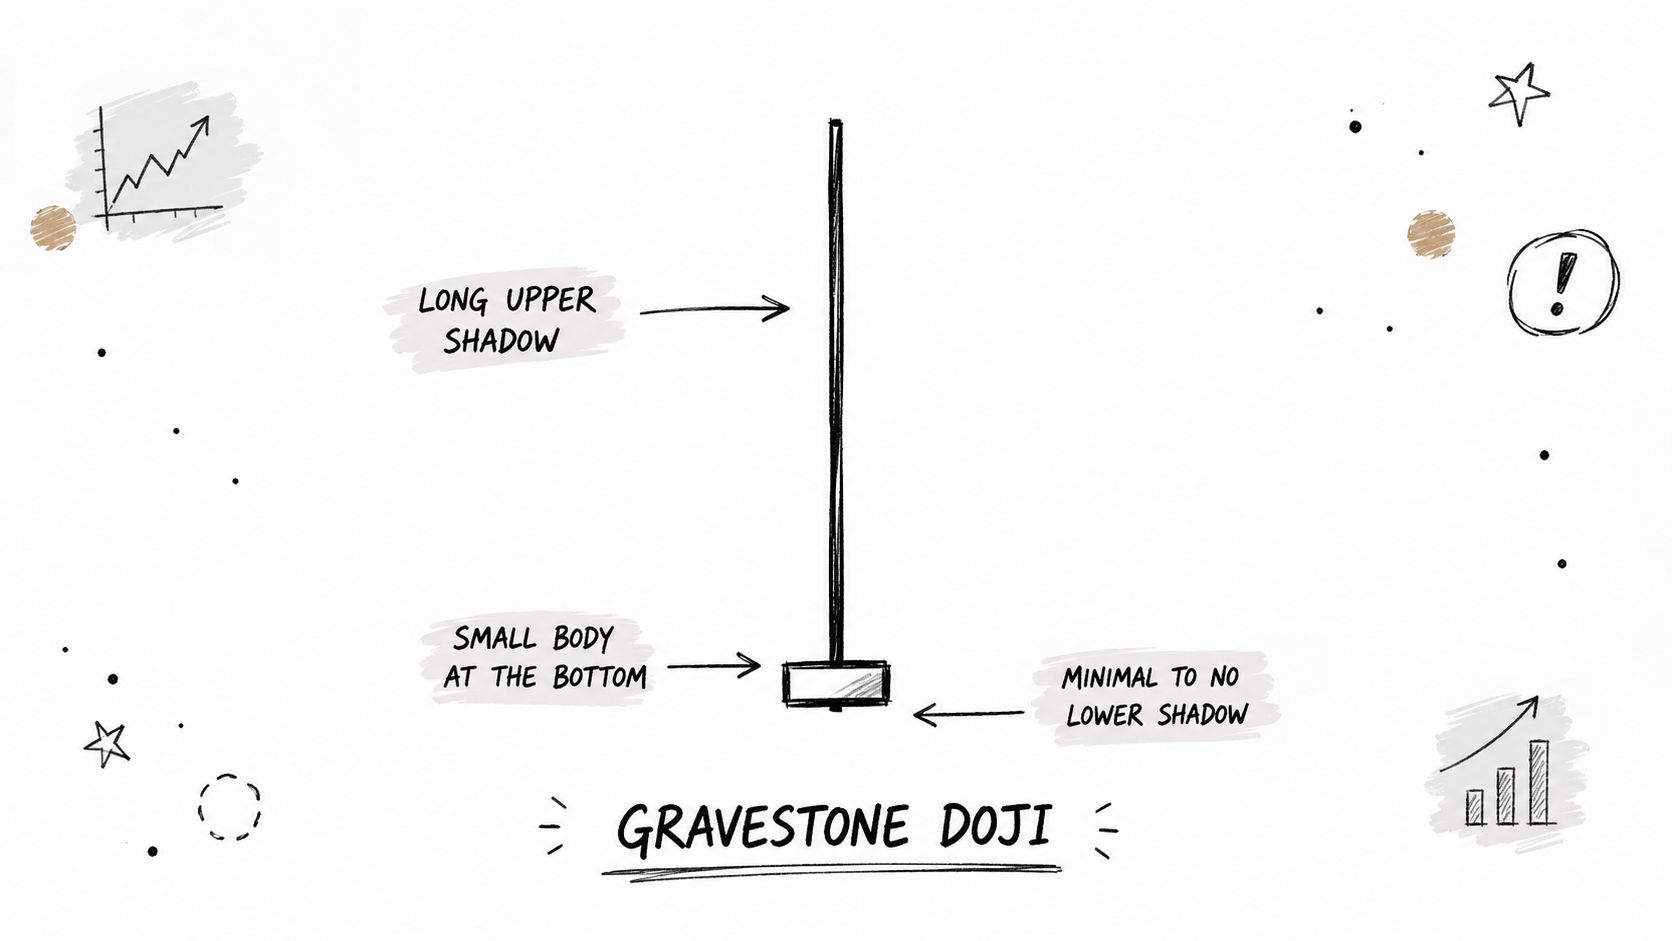
A body that compresses tightly into the session low sends the cleanest message. Once a noticeable lower wick appears, the candle stops being a gravestone and starts being ordinary indecision, and the bearish read weakens with it.
The Psychology
Buyers came in hard. Maybe a news catalyst, a momentum breakout attempt, or plain FOMO drove price up sharply during the session. But somewhere above, sellers were waiting. They sold into all of it and brought price back to where the session began.
Every bull who bought during that session is now exactly at breakeven. Every seller who entered on the upper wick is in profit. That is not a market where buyers have control.
What the Data Actually Says
This is the part most guides skip, and it is the part that should shape how you trade the candle.
Thomas Bulkowski's published research found the gravestone doji reversed lower about 51% of the time, which he describes as close to random, and ranked it 77th out of 103 candlestick patterns overall (ThePatternSite). On its own, that is a coin flip with extra steps.
A separate study summarised by Liberated Stock Trader looked at 1,553 trades across 575 years of data and found something more encouraging: the gravestone was the third-best performing candle in that sample, with a 57% win rate, an average profit of 0.65% per trade, and average winners of 3.8% against average losers of -3.6% (Liberated Stock Trader). The same work reported a reward-to-risk ratio of 1.12:1 and a Sortino ratio of 0.40.
Read those together and the picture is honest. The pattern can be profitable, but the edge is small and the risk-adjusted profile is not strong. Trade selection, confirmation and holding period matter more than the candle itself.
Location changes the odds more than anything else. Bulkowski found gravestone dojis within the lower third of the yearly range performed better, and candles taller than the median travelled roughly 50% farther after the breakout than shorter ones. The best version of this pattern is not about the silhouette. It is about where it prints and how much force created it.
Where It Appears Decides What It Means
At the top of an uptrend, highest conviction
After a sustained rally, buyers made their best effort and sellers rejected it completely. The long upper wick is the story of that failed breakout. Appearing near resistance, it is a genuine warning that the trend is losing steam.
Near key resistance, high conviction
A gravestone forming where price has been rejected before is the cleanest version of the setup. Price tried to break through, failed, and came back down. The candle and the level say the same thing.
Watch volume during the upper wick. Heavy selling into those highs is distribution, and that is the most bearish variant of this candle.
At the bottom of a downtrend, low conviction
Here the pattern is contextually awkward. Price is already falling, some buying appeared, and it failed. That is not a clean setup in either direction. Wait for more price action before doing anything.
One failure mode deserves respect here: many gravestone dojis only pause a move rather than reverse it. In crypto especially, a long upper wick is often just volatility rather than real distribution.
Build the Setup in Layers
A candle scan on its own is too loose to trade. A workable screen starts with the wick, checks context, then forces confirmation.
- Upper shadow test: keep the candle only if the upper wick is clearly extended, not just slightly longer than the body.
- Trend test: prioritise candles that form after a clear advance, not inside sideways chop.
- Location test: prefer candles at visible resistance, a prior swing high, a Fibonacci zone or the upper Bollinger Band, rather than in open air.
- Confirmation test: wait for the next candle to close below the doji's low before acting.
That last rule is the one people skip. Until that close happens, the gravestone has shown rejection but has not shown that sellers can keep control.
Better versions of this setup follow a sequence: strength, then rejection, then weakness on the follow-through. That sequence matters more than the label on the candle. For more on what to confirm with, see our guide to the best indicators for crypto trading.
How to Trade It
Entry: on bearish confirmation, when the next candle closes below the gravestone's low. A more aggressive entry is the open of the candle following the gravestone, and it is worse on average for exactly the reasons above.
Stop loss: above the high of the upper wick. If price closes above that high, the resistance has failed and the idea is wrong.
Take profit: prior support, a Fibonacci retracement below, or a measured move equal to the wick length. Respect the next support zone rather than assuming an instant collapse.
Volume: heavy volume during the upper wick suggests real distribution at the highs.
That is the difference between a chart pattern and a trade plan. A candle tells you where buyers lost control. The follow-through tells you whether sellers actually stepped in.
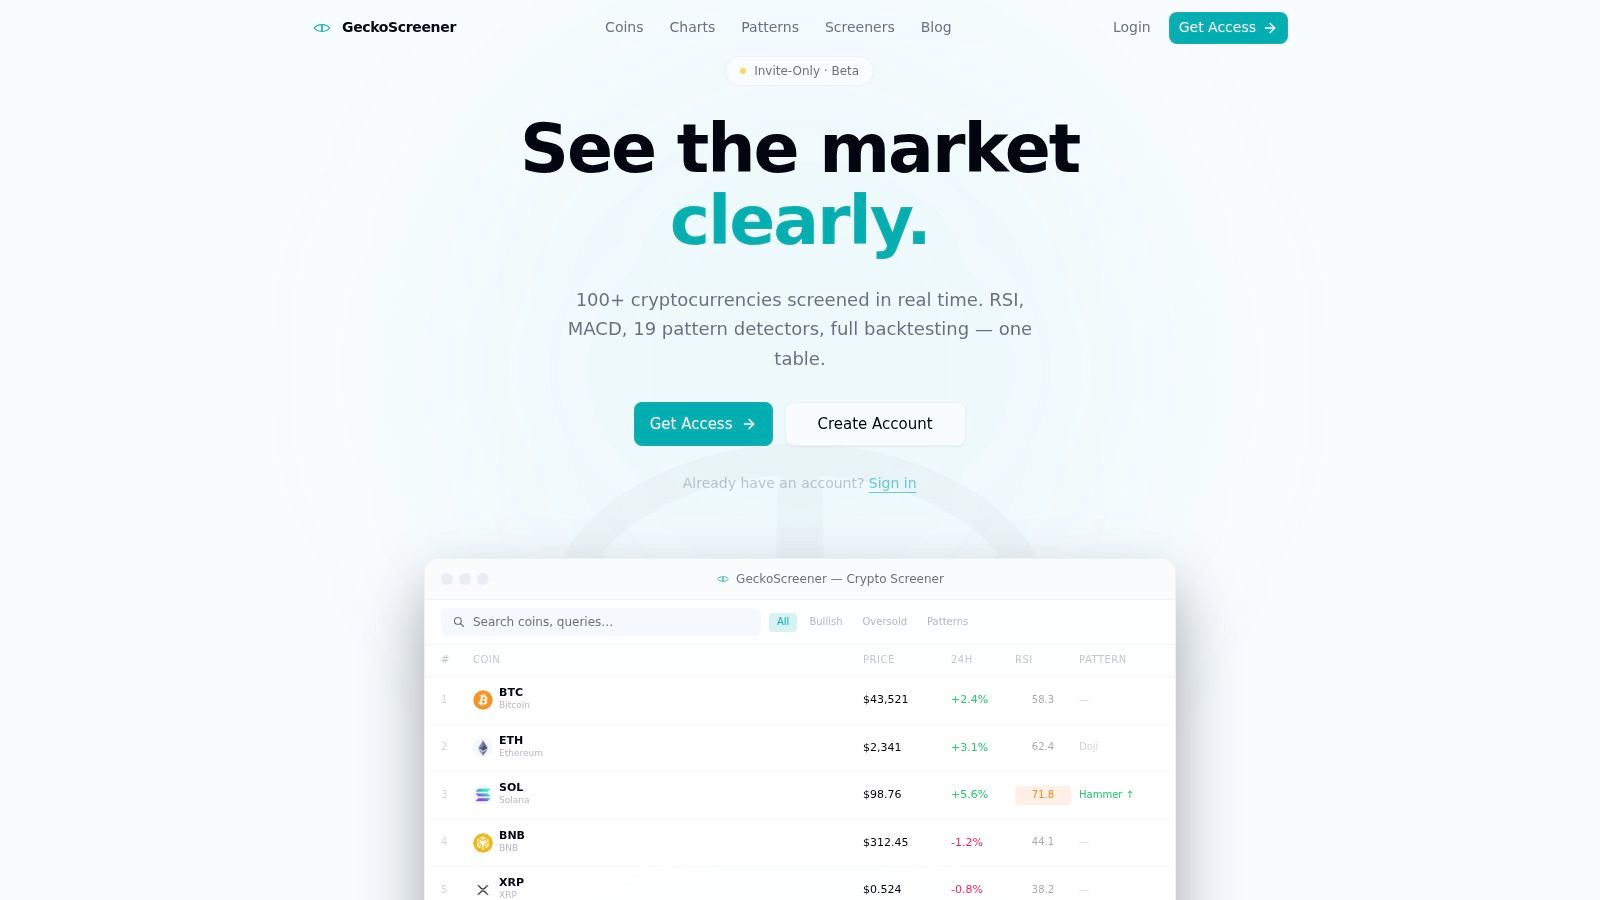
Screening exists so you do not stare at dozens of charts one at a time. You want to scan for the shape, then layer trend, indicator and risk filters on top so you only review setups that still match the larger structure. The strategy builder matters here because it forces the idea into exact rules instead of vague discretion: define the doji filter, require the confirmation candle, and test whether it survives historical conditions before risking anything. For a pattern with mixed standalone performance, that discipline is the whole game. If you want to do that properly, start with this guide to backtesting trading strategies.
Why Crypto Makes This Harder
Crypto makes the gravestone messier than the old candlestick books suggest. The market trades around the clock, intraday volatility is higher, and liquidation cascades print long upper wicks that look like textbook gravestones without carrying any reversal intent at all.
So a candle that looks sharp on a chart can still be noise. Filtering is the answer, not more faith in the shape. A wick after a momentum squeeze deserves attention. A wick in dead range action does not. A rejection at a real level matters more than one floating in empty price space.
Live Gravestone Doji Scanner
Open full screen ↗Switch timeframes (1H · 4H · 1D · 1W) to see which coins are showing this pattern right now.
GeckoScreener Team
Written for the GeckoScreener community. Join us on Telegram →
Related Articles
Start screening cryptocurrencies for free
Apply strategies like this one in real-time across 250+ coins.
Try GeckoScreener →