What Is Risk Reward Ratio: A Complete Guide for 2026
Learn what is risk reward ratio, how to calculate it for crypto trades, and how to pair it with win rate for better strategies.
GeckoScreener Team
Jul 30, 2026 · 12 min read
Updated about 2 months ago

Risk reward ratio is the comparison between how much you can lose on a trade and how much you expect to gain, often written as 1:2 or 1:3. On a trade with a $50 entry, a $48 stop loss, and a $54 target, the reward-to-risk ratio is 2:1 because the potential gain is $4 and the potential loss is $2.
If you've ever stared at a chart, liked the setup, and still hesitated, this is the number you were trying to judge. It tells you whether the idea has enough room to pay you for the risk you're taking, before you click buy or sell.
Table of Contents
- Understanding Risk Reward Ratio in Crypto Trading
- How to Calculate Risk Reward Ratio for Long and Short Trades
- Why Win Rate and Expectancy Matter More Than the Ratio Alone
- Real-World Examples With Crypto Charts
- Adapting Risk Reward Ratio to Crypto Volatility and Market Regimes
- Backtesting Risk Reward Strategies With GeckoScreener
- Common Mistakes and How to Avoid Them
Understanding Risk Reward Ratio in Crypto Trading
A trader can love a setup and still pass on it because the numbers don't work. That's the entire point of risk reward ratio. It compares the amount you can lose on a position with the amount you expect to gain, and traders often write it as 1:2 or 1:3 so the decision is easy to scan before entry.
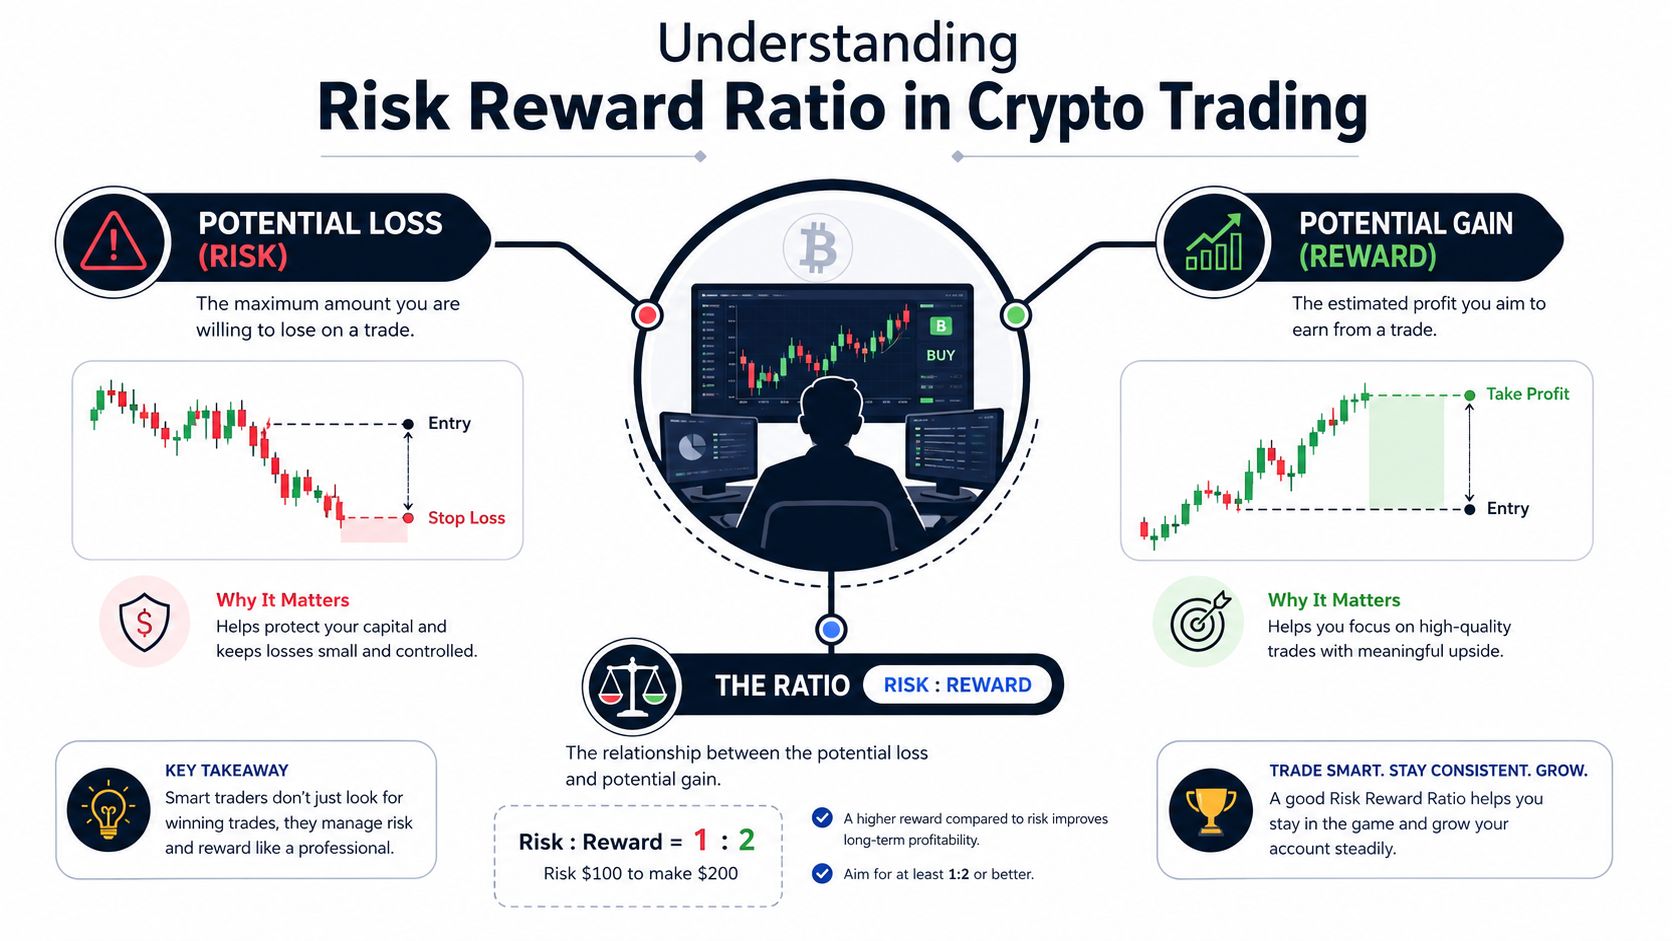
The metric is foundational because it standardizes judgment across stocks, FX, and crypto markets. That makes it easier to compare one setup against another without getting distracted by a chart that looks exciting but offers poor upside relative to downside, which is exactly how major trading education sources frame the idea of comparing expected gain against possible loss Investopedia, IG, and Capital.com.
The long-trade example traders remember
Use the $50 to $48 to $54 trade as a simple whiteboard test. If you buy at $50, set your stop at $48, and target $54, your downside is $2 and your upside is $4.
That creates a 2:1 reward-to-risk ratio, which means you're aiming to make twice as much as you stand to lose on that setup. CMC Markets describes the ratio in terms of entry, stop-loss, and take-profit distances, and gives the same kind of “two units of expected gain to one unit of potential loss” framing for a 1:2 ratio CMC Markets.
Practical rule: if you can't point to the stop and target on the chart in one sentence, you probably don't know your ratio yet.
The value here is discipline. A ratio doesn't tell you whether a trade will win, but it does force you to think in terms of planned loss and planned gain before emotion gets involved.
How to Calculate Risk Reward Ratio for Long and Short Trades
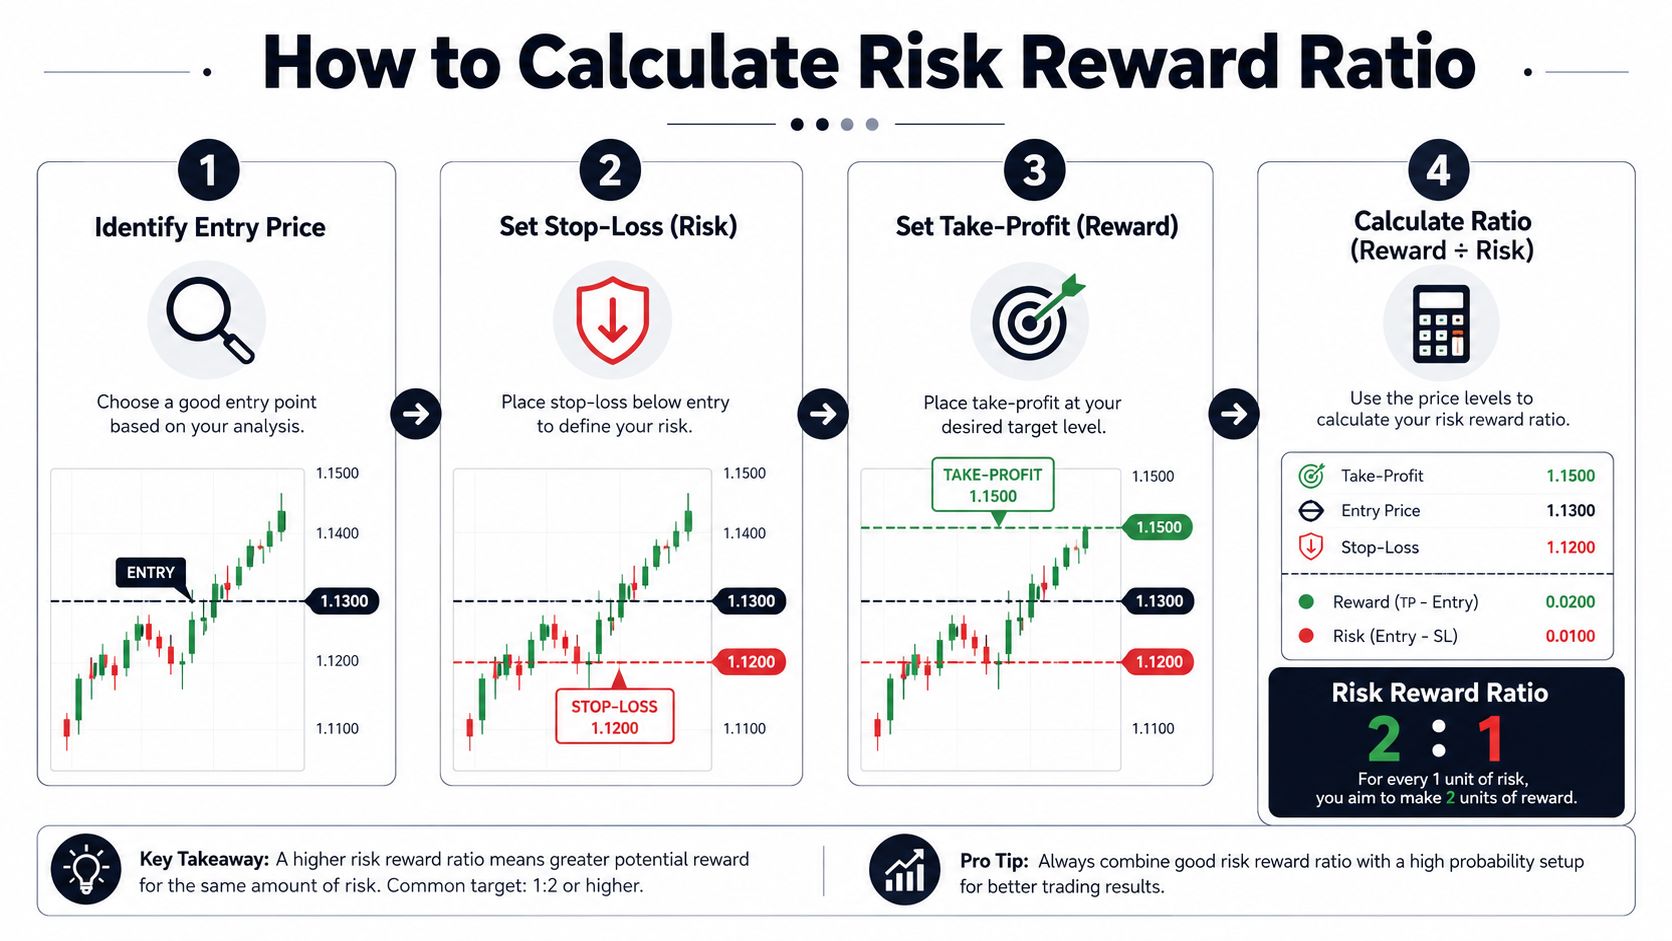
The cleanest way to calculate it is to separate the trade into three parts, entry, stop-loss, and take-profit. CMC Markets states the formula as total profit target ÷ maximum risk price, and the same idea is used by trading educators who calculate reward divided by risk for each trade CMC Markets, For Traders.
Long trades use rising prices
For a long trade, the reward is the distance from entry to take-profit, and the risk is the distance from entry to stop-loss. So if you buy at $50, place a stop at $48, and a target at $54, the reward is $4 and the risk is $2, which gives you 2:1.
That's the easiest version because price moves in the direction most beginners expect. You're buying because you want the market to rise, so the target sits above entry and the stop sits below it.
Short trades reverse the distances
Short trades confuse people because the profit comes from a drop in price. The calculation still uses the same logic, but the distances flip, since the stop-loss sits above entry and the take-profit sits below it.
For example, if you short at $1.20, set a stop at $1.32, and target $0.96, the risk is $0.12 and the reward is $0.24. That's still 2:1, just with the chart facing the opposite direction.
A short trade isn't a special case. It's the same ratio, measured from the other side of price.
If you want to lock in the stop placement side of the calculation, a practical stop workflow matters just as much as the math, and this stop-loss guide fits that part of the process well. Once the stop is fixed, the ratio becomes a simple screen, not a guess.
Why Win Rate and Expectancy Matter More Than the Ratio Alone
A high ratio looks impressive on paper, but it doesn't pay bills by itself. Profitability depends on both the ratio and the win rate, which is why risk-reward is only one piece of strategy design, not the whole answer Hoc-Trade, For Traders.
The break-even logic
One trading-education source says a 1:2 setup can break even with about a 34% win rate Hoc-Trade. That's the trade-off traders often miss, because a bigger average win can absorb a lower strike rate.
A simple way to think about it is this. If your average winner is larger than your average loser, you can be wrong more often and still stay afloat. One analysis of 500,000 traders found that a ratio above 1.0 means average winners are larger than average losers, while below 1.0 means the opposite is true Hoc-Trade.
Expectancy is the real filter
Expectancy combines win rate and payoff structure into one view of the strategy. That's why a setup with a modest hit rate can still be viable if the winners are meaningfully larger than the losers, while a high win rate can still disappoint if the payoff is too small.
| Risk-Reward Ratio | Break-Even Win Rate | Interpretation |
|---|---|---|
| 1:1 | 50% | Needs a balanced strike rate just to stay flat |
| 1:2 | about 34% | Larger winners can offset frequent losses |
| Above 1.0 | depends on structure | Average winners are larger than average losers |
Rule of thumb: don't ask, “What ratio looks good?” Ask, “Does this ratio work with the win rate my strategy actually produces?”
That shift matters because traders don't get paid for elegance. They get paid when the full distribution of wins and losses supports positive expectancy over time.
Real-World Examples With Crypto Charts
A ratio becomes much easier to trust when you can see it on a chart with real price levels. The pattern underneath the numbers matters, because support, resistance, and candle structure tell you whether the stop and target are placed in sensible spots.
A long BTC trade with room to breathe
Take a BTC long at $67,000, with a stop-loss at $65,500 and a take-profit at $70,000. The risk is $1,500, and the reward is $3,000, which gives you a 1:2 ratio.
On the chart, that kind of setup often sits above a support zone, with the stop tucked under the structure that invalidates the trade and the target near a prior resistance area. The important part is not just that the math works, but that price has room to move to the target without hitting the stop on ordinary noise.
A short altcoin trade with the same math
Now flip it. A short altcoin trade at $1.20, with a stop at $1.32 and a target at $0.96, also produces a 1:2 ratio. The risk is $0.12 and the reward is $0.24.
The chart would look different, but the logic is the same. Price would need to break down from the entry area, bounce weakly, and then continue lower toward the target, while the stop sits above the resistance that would invalidate the short.
What the chart should tell you
- Structure first: the stop belongs where the idea is wrong, not where it feels comfortable.
- Target second: the take-profit should line up with a believable price zone, not a wish.
- Ratio last: the number only matters if the chart gives price enough room to reach it.
These examples are useful because they show the same ratio in two directions. A long BTC trade and a short altcoin trade can both be 1:2, even though the chart mechanics are completely different.
Adapting Risk Reward Ratio to Crypto Volatility and Market Regimes
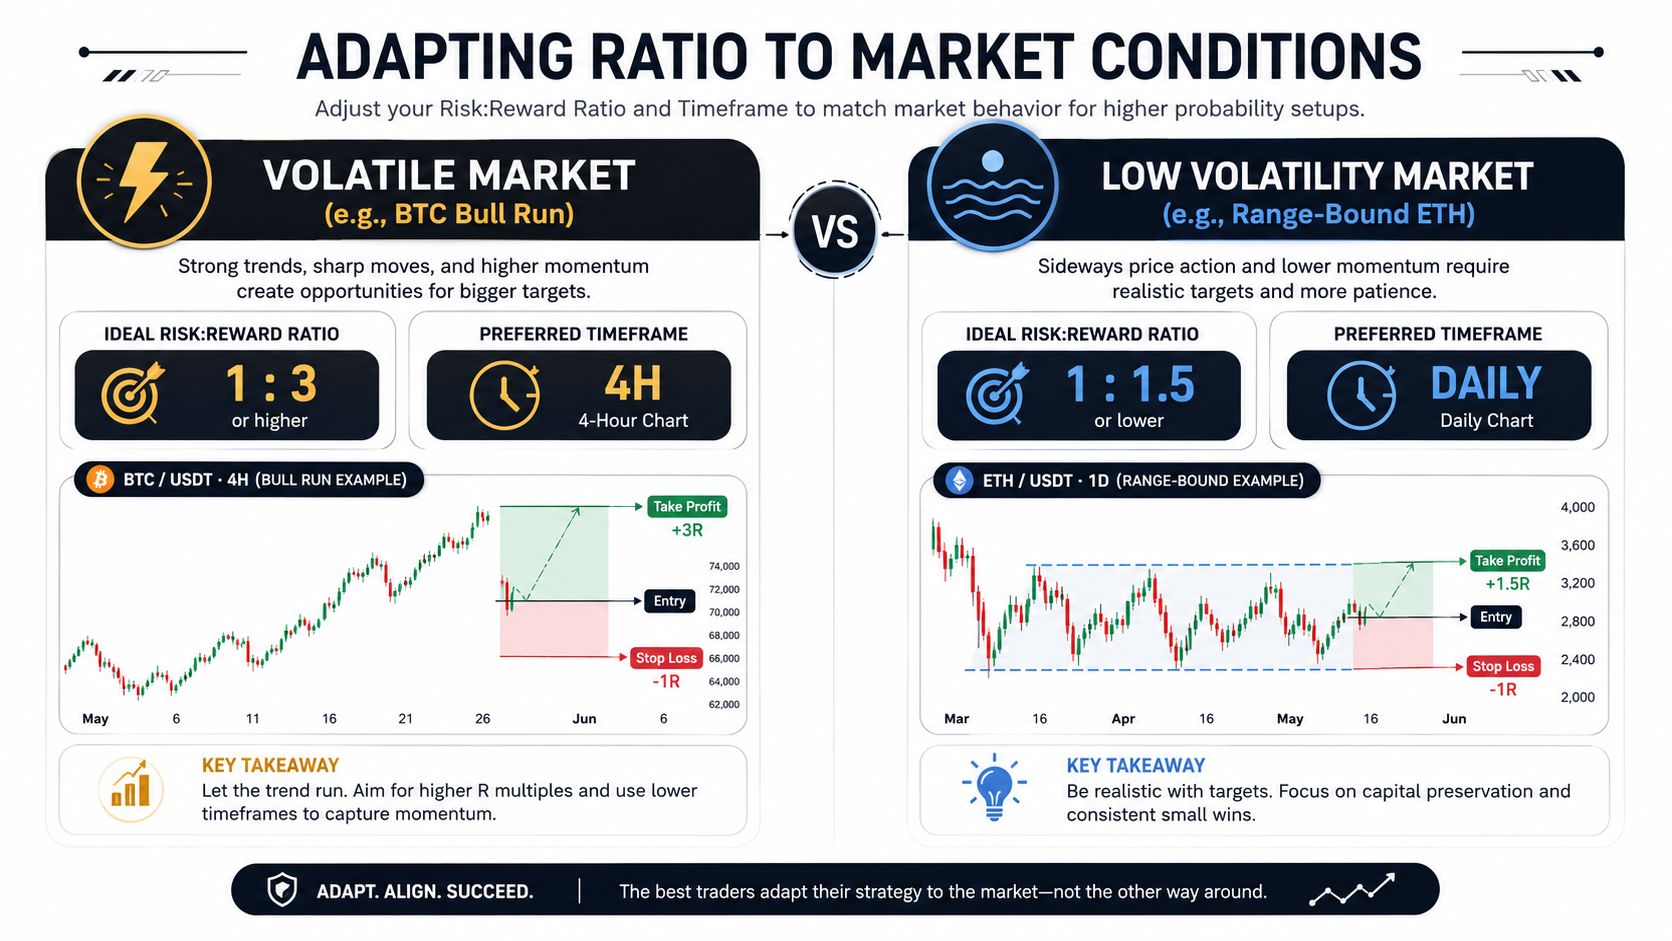
A clean ratio on a spreadsheet can look persuasive and still fail in live crypto trading. Volatile markets can make a fixed setup look better than it is if the stop sits inside normal price noise, or if the target is placed farther away than the market is likely to reach before momentum fades.
Coin type changes the context
BTC, large-cap alts, and lower-liquidity coins do not move at the same pace. A ratio that looks sensible on a liquid major can become awkward on a thinner market, because the stop may get hit by routine noise or the target may sit beyond the range the coin usually covers in that period.
The better question is whether the setup fits the coin's behavior. Position sizing, volatility, and stop placement determine whether the trade can survive long enough for the ratio to matter.
Timeframe changes the problem too
A ratio that makes sense on a daily chart may look poor on a 15-minute chart, and the reverse can also happen. Shorter timeframes usually bring more noise, so the same trade idea can need tighter execution and a more realistic target just to keep the payoff intact.
That is why traders often pair ratio planning with indicator filters before they enter. A useful starting point is this crypto indicator guide, because the same chart cues that help with entry timing also help with stop placement and target selection. The ratio should match the market regime, not force the market to fit the ratio.
A ratio that looks clean on a spreadsheet can fail on a live chart if volatility makes the stop unrealistic.
That is the gap many traders run into. They copy a textbook 1:2 rule, then keep getting stopped out before price has a fair chance to reach the target.
Backtesting Risk Reward Strategies With GeckoScreener
A ratio on paper doesn't prove anything until it survives historical testing. That's where a workflow tool earns its place, because traders need a way to turn a rule into a testable strategy and then see how it behaved across different coins and market conditions.
Set the rules before you test
GeckoScreener offers a plain-language strategy builder that lets traders define entry and exit conditions without writing code, including stop-loss and take-profit parameters. It also supports backtesting over up to nine months across the top 100 coins, with portfolio-mode and per-coin evaluations plus outputs like equity curves and detailed trade history, which makes the ratio easier to assess in context.
Compare the same ratio across assets
A key advantage is that you can check whether the same plan behaves differently on BTC versus altcoins. That matters because a ratio that works on one asset can fail on another if volatility, trend quality, or intraday structure changes the outcome.
The workflow is straightforward. Build the rule, define the stop and target, run the backtest, and read the equity curve before risking live capital. If the trade distribution looks unstable, the ratio may be fine in theory but weak in practice.
Use the backtest as a filter, not a decoration
Backtesting is where you catch the uncomfortable truth early. A setup can look neat on the chart and still produce poor historical results once the stop and target are enforced consistently.
This backtesting guide is relevant if you want the mechanics of the test itself. The broader point is that historical validation helps you avoid deploying a ratio that only seems sensible in hindsight.
Common Mistakes and How to Avoid Them
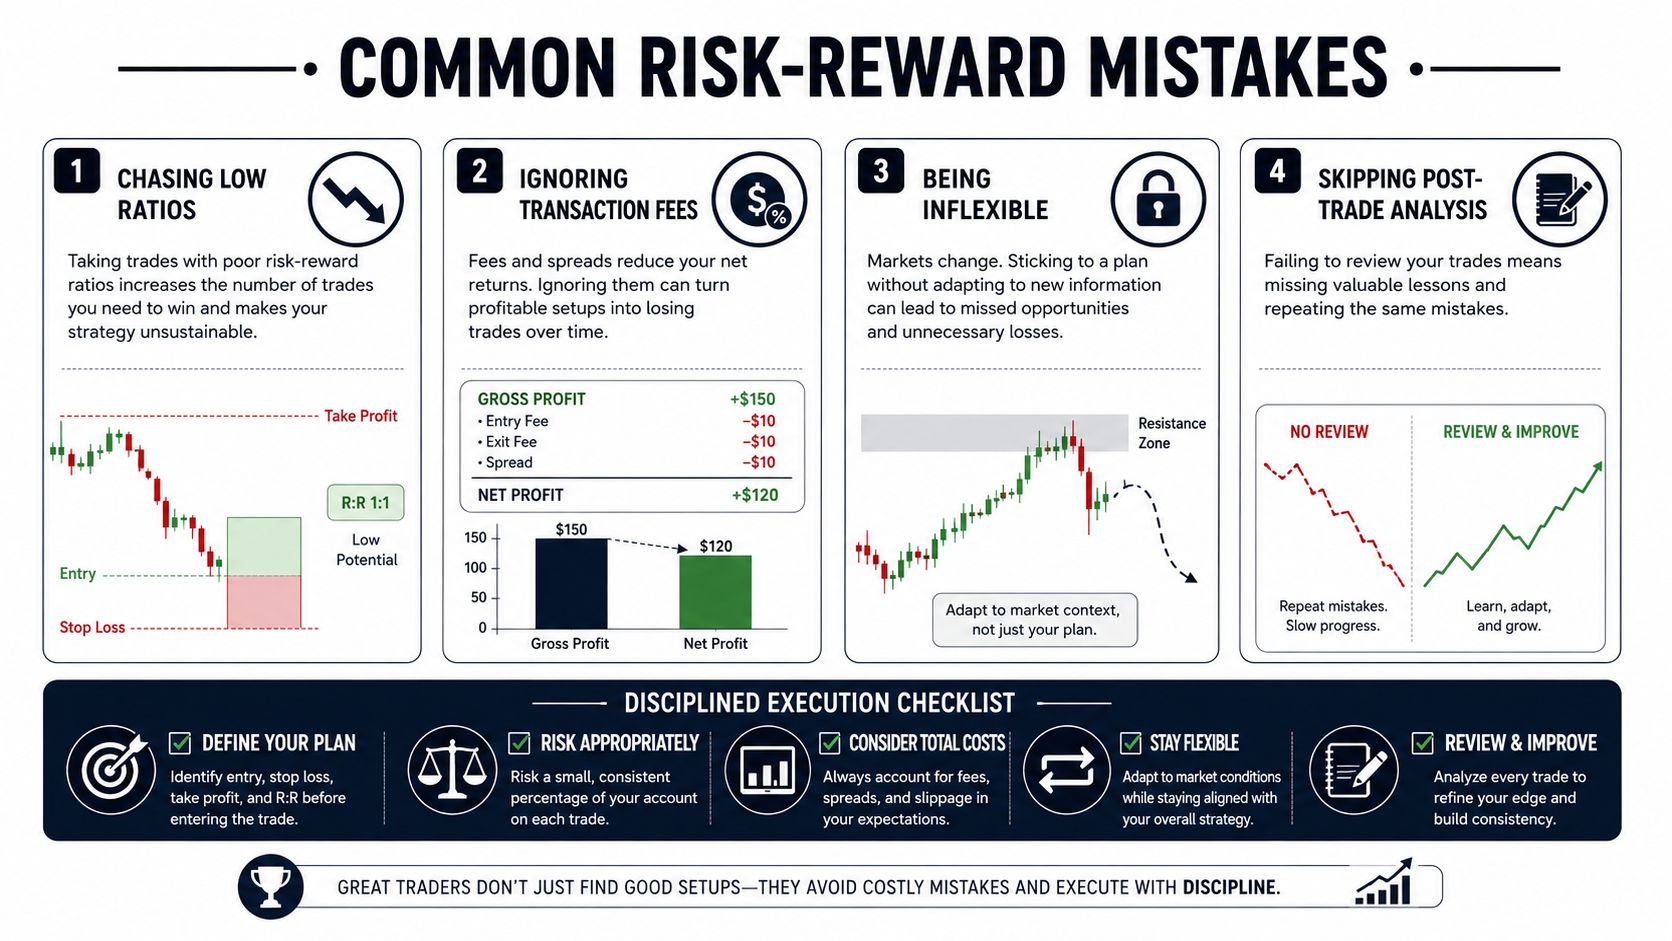
The most common error is treating risk-reward as a standalone green light. It isn't. IG defines it as a way to assess expected return per unit of risk, and Capital.com frames it as potential reward divided by potential loss, which means a higher value gives you more expected return for each unit of risk taken, not guaranteed profit IG, Capital.com.
The mistakes that keep repeating
- Ignoring win rate: A clean ratio means little if your strategy can't hit enough winners to support it.
- Using one ratio everywhere: BTC, altcoins, and different timeframes don't deserve identical thresholds.
- Setting stops too tight: Volatile markets can knock out a good idea before it has room to work.
- Skipping backtests: If you haven't tested the rule, you're guessing with money.
A disciplined checklist is simpler than most traders think. Define the stop, define the target, check whether the ratio is acceptable, and then validate the rule on historical data before you size up.
A short checklist worth keeping
Checklist: pair the ratio with win rate, adjust for volatility, respect trade direction, and review the actual trade history instead of the hoped-for outcome.
That's the difference between a ratio that guides decisions and one that just decorates a chart. The goal isn't to chase the biggest number, it's to build a repeatable process that fits the market you're trading.
If you want a workspace that helps you screen crypto setups, define stop-loss and take-profit rules, and validate those ideas before you trade them, visit GeckoScreener. It's built for traders who want to connect chart structure, strategy rules, and backtesting in one place.
GeckoScreener Team
Written for the GeckoScreener community. Join us on Telegram →
Related Articles


Start screening cryptocurrencies for free
Apply strategies like this one in real-time across 250+ coins.
Try GeckoScreener →