#morning star reversal pattern#candlestick patterns#crypto trading#bullish reversal#technical analysis

Morning Star Reversal Pattern: Your 2026 Guide

Master the morning star reversal pattern in crypto. Learn identification rules, confirmation techniques, and how to spot high-probability setups with

G

GeckoScreener Team

Aug 16, 2026 · 14 min read

Updated 4 days ago

Morning Star Reversal Pattern: Your 2026 Guide

A historical study of 4,120 markets across 59 years identified 22,863 morning star occurrences, or roughly one formation every 682 candles on average (LuxAlgo's morning star reference). That frequency matters. The pattern appears often enough to screen systematically, but not so often that every chart becomes an excuse to trade.

The catch is that the candle shape alone isn't the edge. The morning star reversal pattern works best when a clear downtrend meets meaningful support, the star shows seller exhaustion, and the third candle brings convincing buying participation. Without that context, you're mostly trading a visual resemblance.

Table of Contents

Why the Morning Star Reversal Pattern Outperforms Most Candlestick Signals

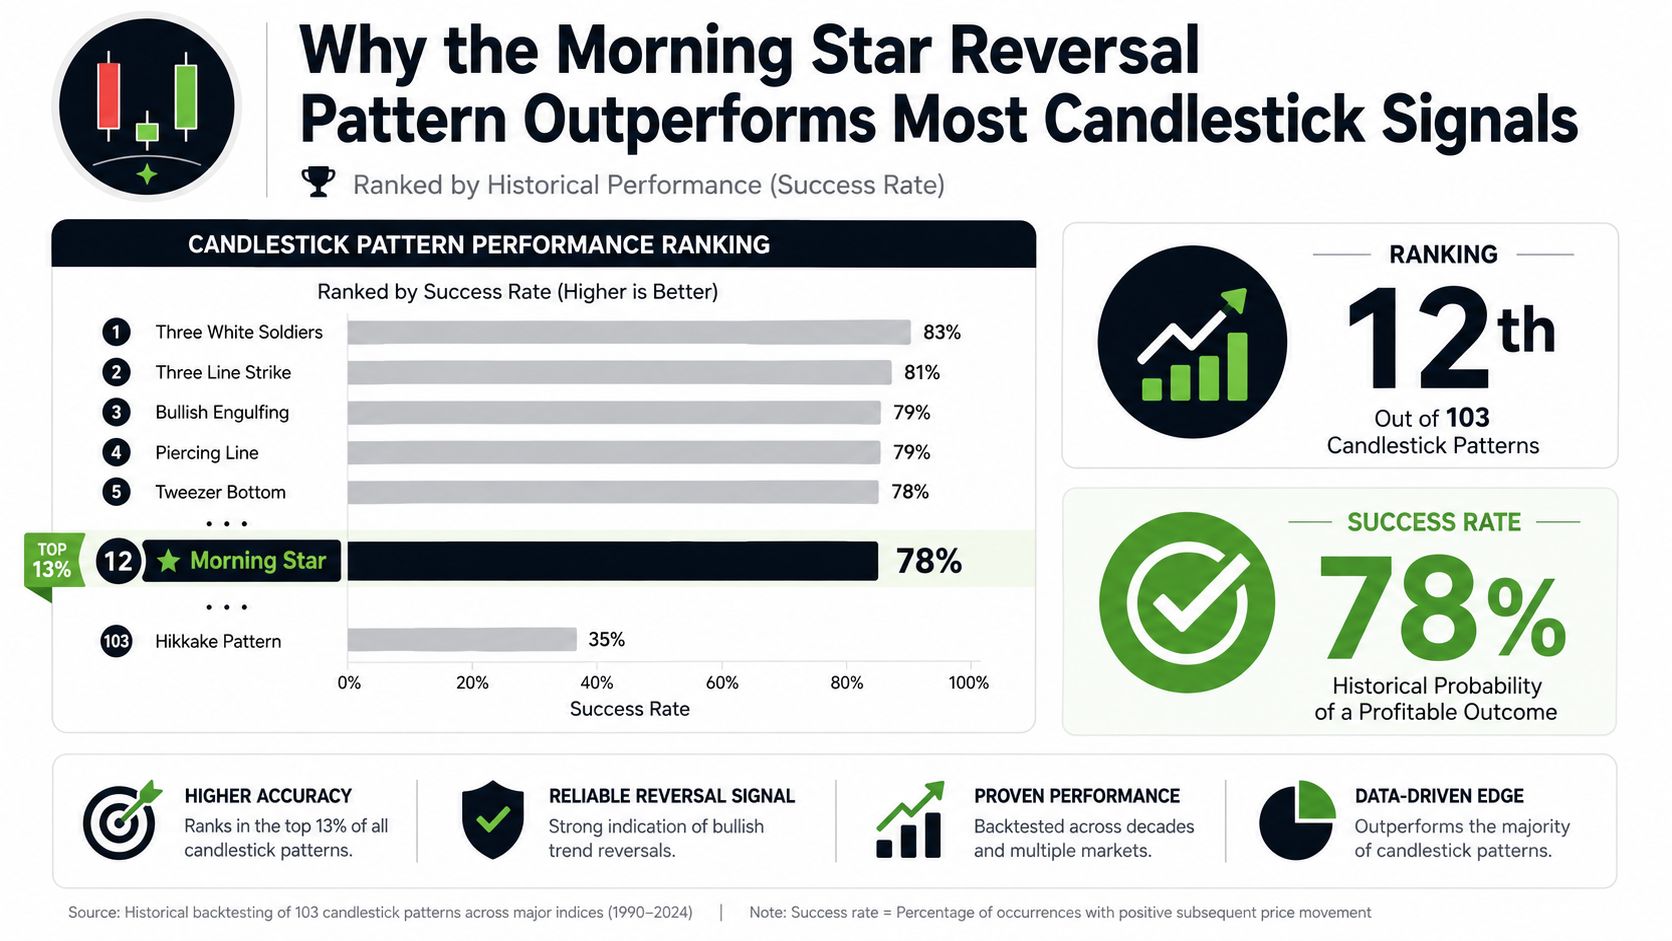
Bulkowski's research classified the morning star as a bullish reversal that behaved as expected 78% of the time and ranked it 12th among 103 candlestick patterns by performance (Bulkowski's Morning Star research). Those figures make the pattern worth studying, but they don't mean every formation deserves a long position. “Behaved as expected” describes the historical pattern outcome, not a guaranteed profit on every trade.

The same research shows why market regime matters. In one bear-market down-breakout scenario, the best 10-day average move after the breakout was a drop of 8.53%, even though the morning star is generally categorized as bullish (Bulkowski's Morning Star research). A trader who memorizes the label but ignores direction, support, and breakout behavior can easily apply a bullish pattern at the wrong moment.

An infographic showing that the Morning Star reversal pattern ranks 12th with a 78% success rate.

The pattern is frequent, but not abundant

A modern statistical review of the same broad historical sample reported a 74.2% overall confirmation rate, with confirmation typically occurring within 3.4 candles and invalidation within 8.4 candles (LuxAlgo's morning star reference). Those results suggest the formation has enough structure for systematic screening, but the confirmation window still requires discipline.

Crypto traders often see a different baseline because lower timeframes contain more noise and fewer clean trend transitions. One public backtest covering 312 crypto occurrences across BTC, ETH, SOL, and BNB reported a 68.3% baseline success rate, while broader trading guides place raw pattern performance closer to 55% to 60% (YouPattern's morning star backtest). These figures shouldn't be blended into one universal win rate. They describe different samples, markets, and rules.

📌

Practical rule: Treat the candle formation as a screening event, not a complete trade thesis.

The advantage comes from selection. A morning star at support after sustained selling gives you a reason to consider a reversal. The same shape in a sideways range, beneath resistance, or during aggressive bearish continuation doesn't carry the same information. Professional execution starts with the environment, then evaluates the candles.

The Three-Candle Structure and Identification Rules

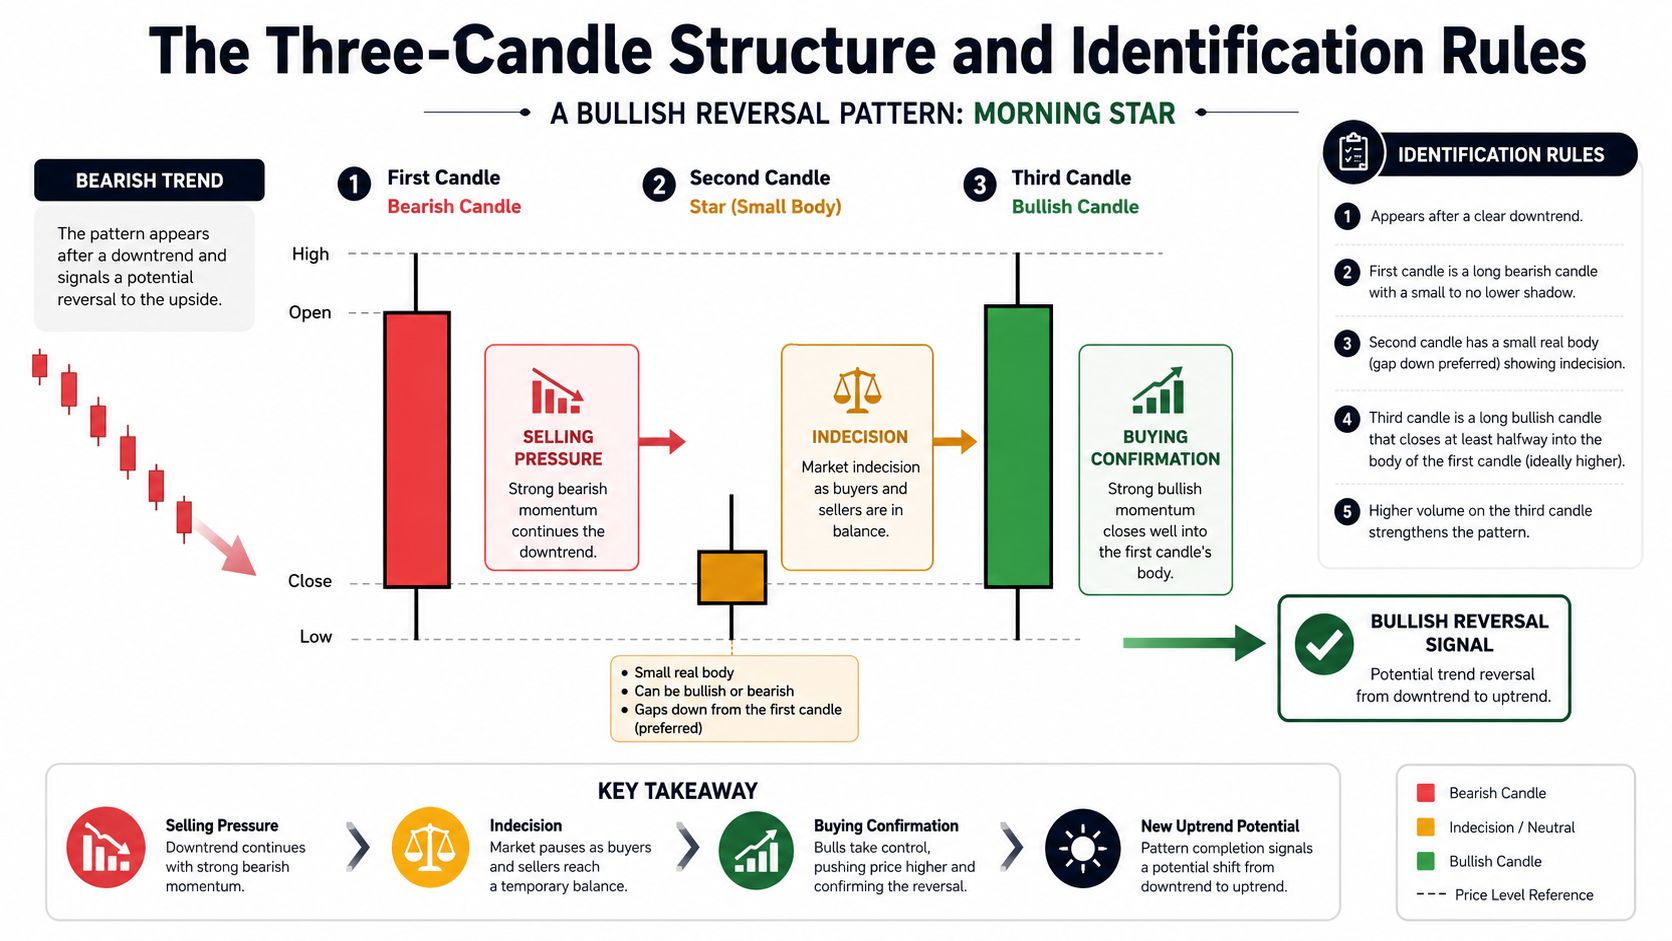
A valid morning star has a strict sequence. Candle one is a long bearish candle, candle two is a small-bodied star, and candle three is a strong bullish candle that closes well into candle one's real body (Getswoopr's morning star definition).

The first candle should show continued selling pressure rather than a random red candle inside a range. Its body establishes the downside impulse that the next two candles must challenge.

Read each candle as a change in control

The second candle is the hesitation point. It has a small body, often reflecting indecision or exhaustion, and traditionally gaps below the first candle. A gap strengthens the classic appearance, but it isn't mandatory, particularly in crypto and other markets that trade continuously (SetupSignals' explanation of morning star gaps).

The third candle provides the decision. It should be bullish and close at least halfway into the first candle's real body, using the midpoint as the practical confirmation level (IntelliTrade's morning star rules). A deeper close, approaching the upper portion of candle one's body, signals stronger recovery than a marginal penetration.
CandleWhat it should showWhat it means
FirstLong bearish bodySellers control the move
SecondSmall body, often below candle oneSelling momentum is fading
ThirdStrong bullish body closing into candle oneBuyers are attempting to take control

The gap on candle two is useful, but traders shouldn't reject a crypto formation solely because prices opened near the previous close. The structure matters more than a textbook gap when the market trades around the clock.

Avoid loose pattern matching

A large second candle weakens the formation because it doesn't show a meaningful pause. A third candle that fails to reach candle one's midpoint hasn't confirmed a bullish handover. And a three-candle sequence without a preceding downtrend isn't a reversal setup, because there's no established decline to reverse.

The clean checklist is simple:

  • Trend: Price has been moving lower before the formation.
  • Candle one: Selling pressure is visible in a substantial bearish body.
  • Candle two: The body is clearly smaller and reflects hesitation.
  • Candle three: Buyers produce a strong close at least halfway into candle one.
  • Location: The pattern forms near support or another meaningful reaction area.

A detailed infographic explaining the components and rules for identifying a bullish Morning Star candlestick reversal pattern.

The visual sequence is easier to understand when you watch the transition candle by candle.

When the Pattern Works Best and When to Avoid It

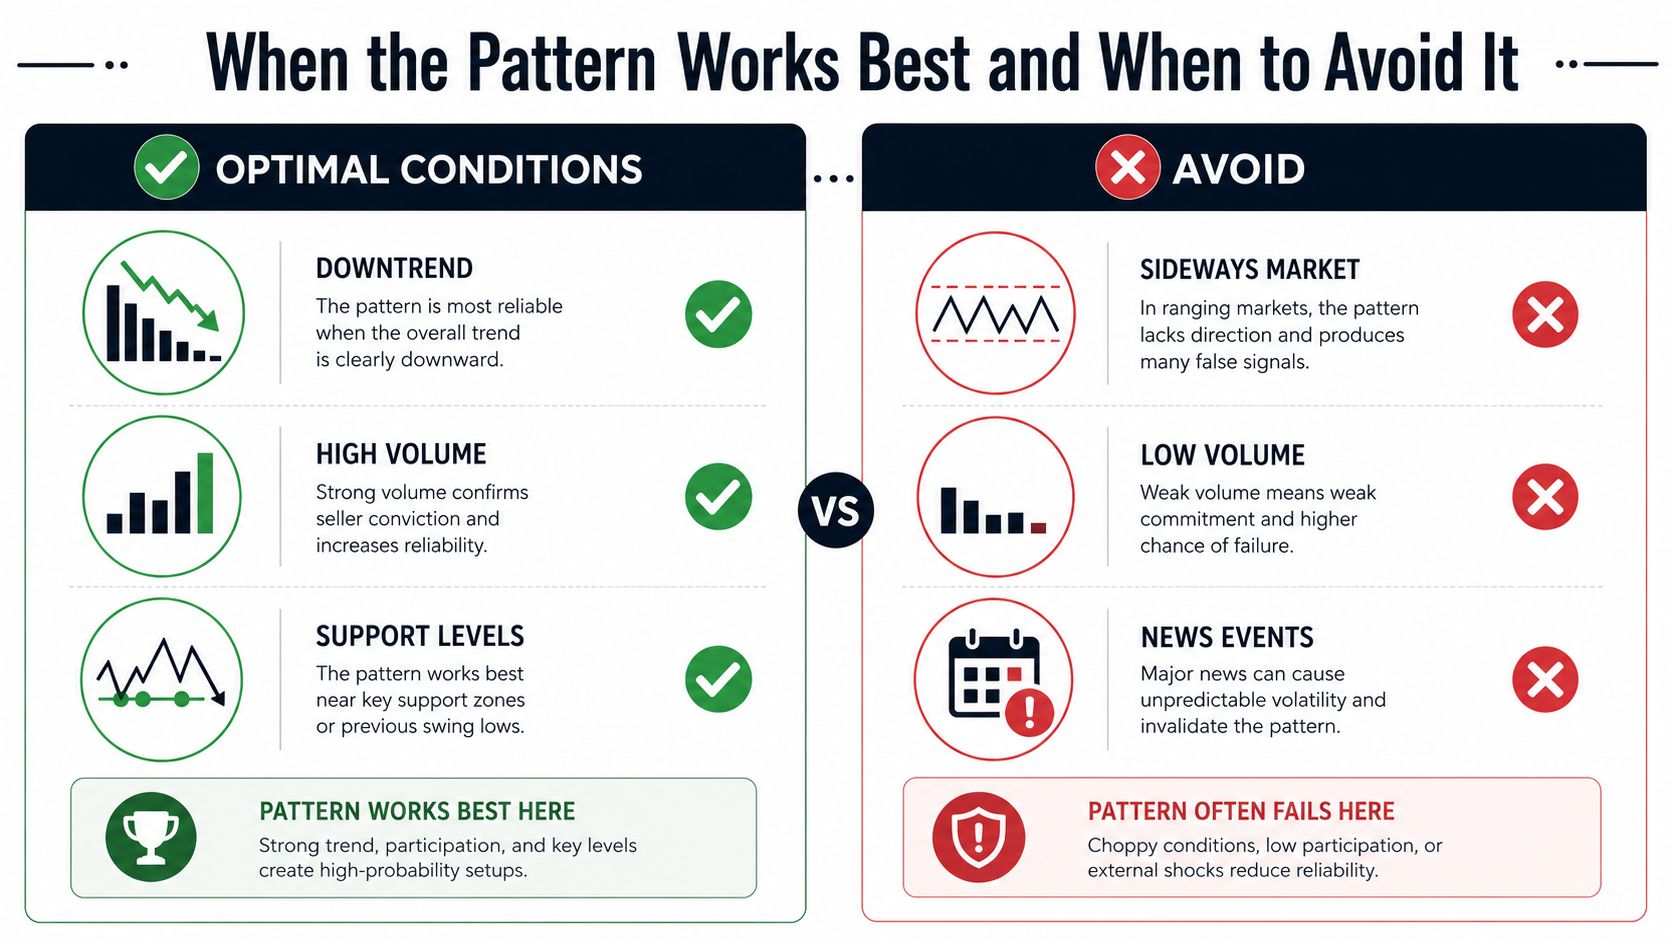
The morning star reversal pattern earns attention after a clear downtrend, particularly when price reaches established support and the third candle confirms the shift before entry (Dukascopy's morning star guide). Support gives the formation a tradeable explanation: sellers have driven price lower, momentum has begun to fade, and buyers are defending an area that previously attracted demand.

Context matters more than the shape alone. In the middle of a noisy range, price may bounce because the range is oscillating, not because a lasting reversal has started. Avoid the setup when bearish pressure remains strong or the third candle looks like a temporary recovery rather than a decisive change.

A comparison chart showing optimal conditions versus market situations to avoid when trading the morning star reversal pattern.

Compare the setup environment

More credible conditionsLower-quality conditions
Clear sequence of lower pricesSideways, directionless movement
Reaction at visible supportFormation beneath nearby resistance
Star shows reduced activityLow participation throughout
Third candle confirms stronglyThird candle barely recovers candle one

Timeframe changes the reliability of the information. Higher-timeframe candles combine more trading activity into each bar, so a confirmed reversal can carry more weight than the same shape on a very short chart. Lower timeframes can assist with execution, but they require stricter context and should not replace the higher-timeframe trend.

Volume and support filters are what turn a baseline signal into a higher-conviction trade candidate. A public backtest of 312 crypto occurrences across BTC, ETH, SOL, and BNB recorded a 68.3% baseline success rate. Adding a breakout-day volume filter improved that result by roughly 9%, reaching approximately 77% in that specific backtest (YouPattern's crypto backtest). That result applies to the tested sample, not to every future formation. GeckoScreener can help locate candidates, but the chart still needs support, trend, and breakout participation checks.

Pass on formations with an unclear trend, no meaningful support reference, or a weak third candle. A missed trade costs less than a long position built on a pattern that never completed.

Confirmation Techniques That Separate Winners from False Signals

The third candle is confirmation, but confirmation shouldn't stop at color and body size. Start by comparing activity across all three candles. The star candle typically shows lower participation as downside momentum fades, while the bullish third candle should expand on above-average volume to demonstrate fresh demand (Phemex's volume guidance for morning stars).

Some trading guides use a threshold of around 1.5 times the prior average volume for the reversal candle (Phemex's volume guidance for morning stars). Use that as a filter to test, not as a universal law. Volume behavior varies by exchange, asset, session, and timeframe.

Build confirmation in layers

Support should come before indicators. Mark the level where price previously reacted, then ask whether the star formed close enough for the level to matter. If the formation appears far from support, a bullish candle may be nothing more than a countertrend bounce.

Trend tools can then add structure:

  • Moving averages: Use them to judge whether price is stretched below its prevailing trend, not as automatic buy triggers.
  • RSI: Look for weakening downside momentum or an oversold condition, but don't buy solely because RSI is low.
  • Volume: Require stronger participation on candle three than during the hesitation phase.
  • Market structure: Check whether the third candle reclaims a meaningful level or merely closes inside a broad range.

The best indicators for crypto trading can help organize this confluence, but indicators shouldn't overrule price location. Five signals that all measure the same momentum condition don't provide five independent reasons to trade.

Plan for the retest

The modern review reported a 97% retest rate of the entry level after confirmation, so entering immediately at the third candle's close isn't the only approach (LuxAlgo's morning star reference). A retest can offer better placement, but waiting also creates the risk that price won't return.

A practical plan is to define two entries before the trade forms. The aggressive entry uses the confirmed third-candle close. The conservative entry waits for a controlled retest of the reclaimed area, with the stop still tied to the pattern's invalidation point. Never move the stop closer because the retest feels uncomfortable.

Real Chart Examples and Trade Setups

The most useful chart example isn't a perfect winner. It shows how the same three candles can produce different decisions depending on location, volume, and follow-through.

Consider a hypothetical BTC daily chart after a sustained decline. Price reaches a clearly watched support zone, candle one closes with a wide bearish body, candle two forms a small body near the lows, and candle three closes above candle one's midpoint. Volume expands on the bullish candle, and the close reclaims a nearby level that had previously acted as support.

That setup earns attention because several independent observations agree:

  • Trend context: Price has been declining.
  • Pattern structure: All three candles have distinct roles.
  • Location: The formation appears at support.
  • Participation: Buyers show stronger activity on confirmation.
  • Execution: The entry waits until candle three closes.

The stop belongs below the star's low, where a break would invalidate the failed-handoff thesis. The first target should be a nearby swing high or resistance area, while a later target can use the next higher-timeframe barrier. The exact price levels must come from the chart, not from a fixed percentage or a memorized target.

A failed setup tells you more

Now take the same visual shape inside a sideways market. Price drops briefly, prints a small star, and produces a bullish third candle, but the formation sits beneath resistance. Volume stays subdued, and the third candle closes only slightly into candle one's body.

That isn't equivalent to the BTC example. The pattern has no clear downside exhaustion, no strong location advantage, and no convincing demand. A trader who enters because the sequence looks familiar is ignoring the missing evidence.

📌

Chart-reading test: Before asking where to enter, explain why sellers should be unable to continue lower at this exact location.

For live chart review, mark candle one's midpoint, candle two's low, the nearest support, and the first resistance above price. Add volume beneath the chart and annotate whether the third candle expanded or contracted. This creates a repeatable record even before dedicated trading features or backtesting tools are available.

Finding Morning Star Patterns with GeckoScreener

Manual scanning across a large crypto watchlist creates two problems. You may miss a formation while moving between charts, or you may lower your standards after reviewing too many mediocre candidates. A systematic screener keeps the first pass consistent.

GeckoScreener can detect bullish candlestick conditions across its crypto coverage, combine pattern logic with filters such as volume and indicators, and refresh market data every 60 seconds, according to the publisher's product information. It also supports a plain-language strategy builder, so you can describe conditions without writing code. For a broader walkthrough, use the GeckoScreener complete guide.

Build the scan around rejection criteria

Start with the morning star detector, then add context instead of accepting every result. A useful screening request might specify:

  1. A bullish morning star has appeared.
  2. Price is in a downtrend.
  3. The third candle has stronger volume than the preceding activity.
  4. Price is near a support area.
  5. The confirmation candle has closed, rather than still forming.

The screener's result is a shortlist, not an automatic entry. Open each chart and verify the body proportions, the midpoint close, support quality, and the distance to resistance. Pattern detectors can identify a mechanical shape, but they can't replace judgment about whether the surrounding market structure makes the signal meaningful.

Save the conditions that produce clean candidates, then review the rejected examples as carefully as the accepted ones. If the scan returns too many formations in ranges, tighten the trend or support requirement. If it returns almost nothing, relax only one condition at a time so you know what changed.

GeckoScreener's current role is detection and workflow organization. Trading features and backtesting features aren't available yet, and backtesting and alerts will be live very soon. Until then, export or record candidates manually, including the asset, timeframe, candle date, volume behavior, entry idea, invalidation level, and eventual outcome.

Building Your Morning Star Trading Framework

A workable framework turns pattern recognition into a decision sequence. The order matters because it prevents a visually attractive candle from overriding risk controls.

A four-step infographic illustrating the Morning Star trading framework strategy for identifying and trading candlestick patterns.

Start with validity, then earn the entry

Step one, identify the formation. Confirm the preceding downtrend, the bearish first candle, the small star, and the bullish third candle. Reject the setup if candle three hasn't closed at least halfway into candle one's body.

Step two, apply filters. Check support, volume, higher-timeframe direction, and nearby resistance. The objective isn't to collect indicators. It's to remove situations where the pattern has no clear location advantage.

Step three, define risk. An entry can occur after candle three closes or after a retest. Place the invalidation below the star's low, then calculate position size from the amount you're willing to lose, not from how confident the chart appears.

Step four, set targets. Use prior swing highs and resistance zones. A historical review reported an expected outcome of 0.152 dollars per dollar risked and a 38.4% hit rate for a 2:1 risk-reward target, figures that describe a dataset and rule set rather than a promise for your next trade (LuxAlgo's morning star reference). Use those results as a reason to track expectancy, not as a substitute for your own testing.

A simple journal should capture the pattern quality, support type, volume condition, entry method, stop distance, target location, and outcome. The guide to backtesting trading strategies provides a useful structure for turning those observations into explicit rules when the relevant tools are available.

📌

Execution standard: If you can't state the trend, support, confirmation, invalidation, and target before entering, the setup isn't ready.


GeckoScreener can help you scan for morning star formations, combine them with volume and market-context conditions, and organize candidates while its trading and backtesting features are being prepared. Visit GeckoScreener to build a repeatable screening workflow now, then use the forthcoming backtesting and alerts to validate and monitor the rules you trade.

G

GeckoScreener Team

Written for the GeckoScreener community. Join us on Telegram →

Start screening cryptocurrencies for free

Apply strategies like this one in real-time across 250+ coins.

Try GeckoScreener →