Fundamental vs Technical Analysis in Crypto: How to Use Both
Fundamental vs technical analysis in crypto isn't a choice. One decides what's worth holding, the other decides when to trade it. Here's how to run both.
GeckoScreener Team
Sep 5, 2026 · 7 min read
Updated about 2 months ago
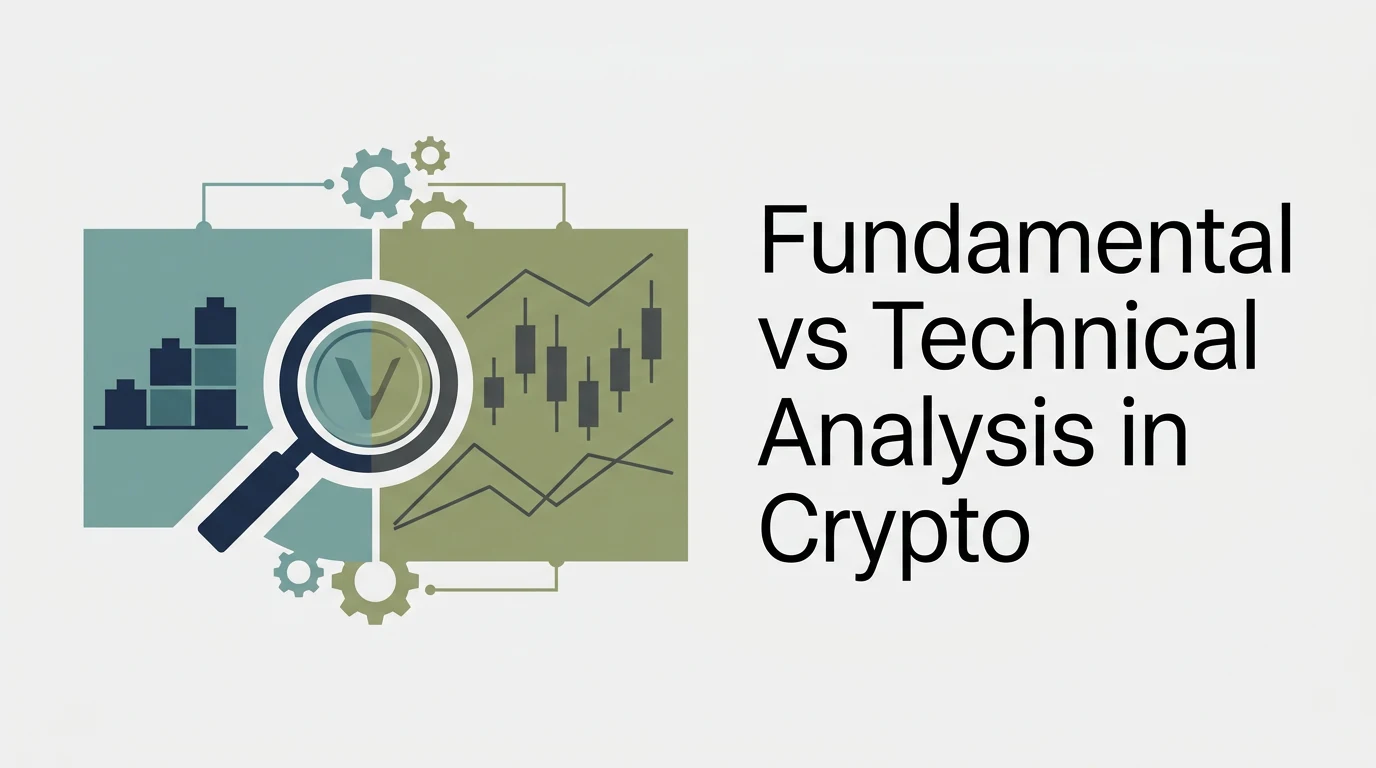
Someone holding a coin through a bad week gets two pieces of advice that contradict each other. "The chart's broken, get out." "The fundamentals haven't changed, hold." That's fundamental vs technical analysis in crypto in miniature: two people looking at the same asset, answering completely different questions. Neither one is wrong. They were never competing for the same job.
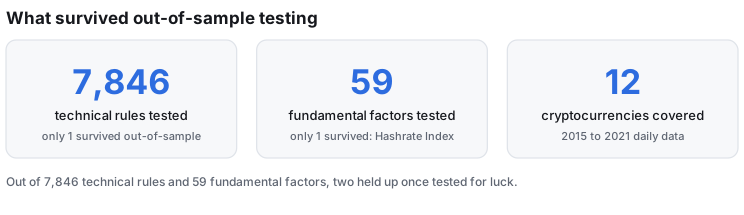
In short: technical analysis reads the chart to decide when to enter or exit. Fundamental analysis reads the project itself, team, tokenomics, usage, to decide whether it's worth holding at all. A 2024 academic study tested 7,846 technical rules and 59 fundamental factors on 12 major cryptocurrencies and found that almost none of them held up once tested honestly. Only one from each side survived. The lesson isn't to pick a camp. It's to use each for the question it can actually answer, and stay skeptical of both.
Fundamental vs technical analysis: what each one is actually looking at
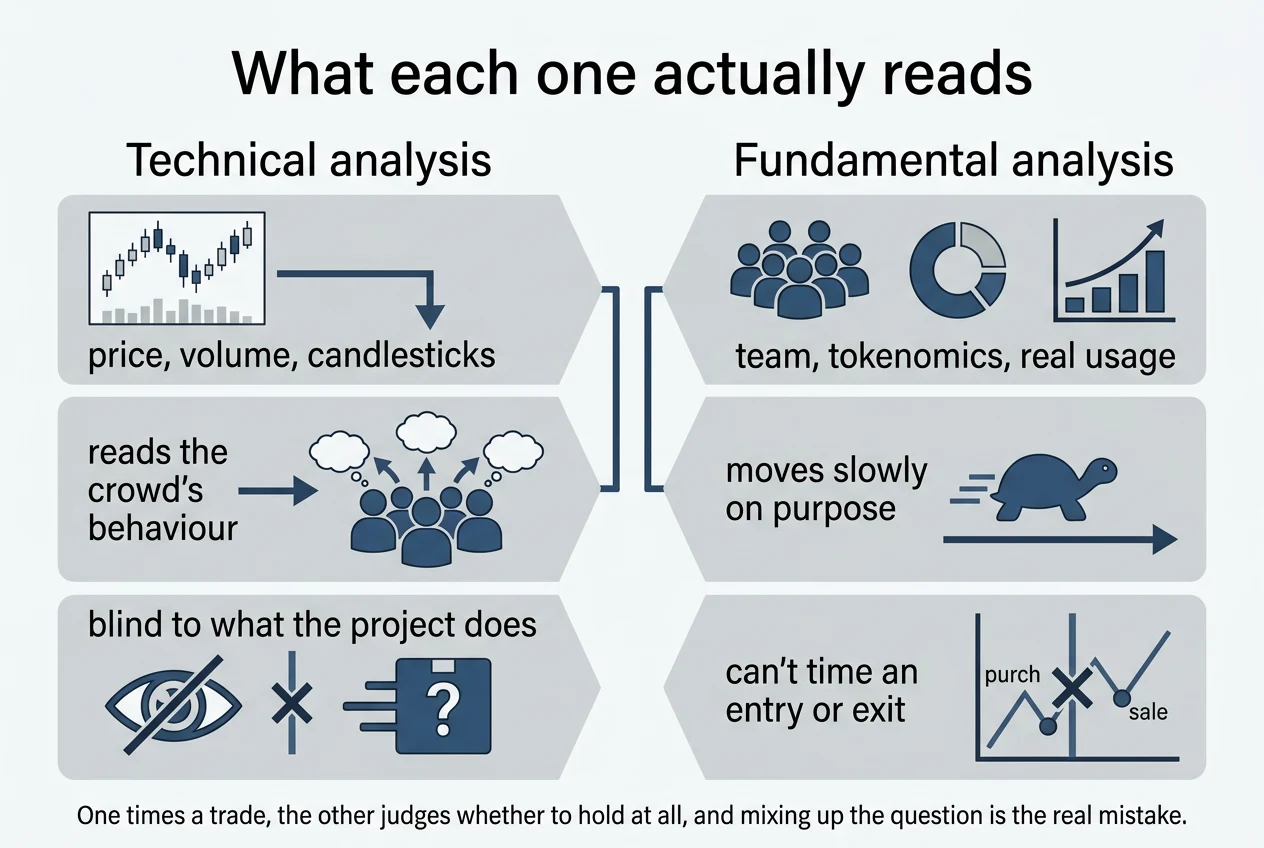
Technical analysis only ever looks at the market itself: price and volume, plus the candlestick shapes and indicators built out of those numbers. RSI, moving averages, a bull flag, a hammer at support. It's reading the crowd's behaviour, encoded in the trade history. It has no opinion on whether the project behind the ticker does anything useful, because it can't see that. It only sees the tape.
Fundamental analysis looks at everything the chart can't show: who's building the thing, how the token supply unlocks over time. Whether real people use it for something, and how it holds up against the wider macro picture. It moves slowly on purpose. A vesting schedule doesn't shift week to week, and neither does a project's actual user count. That's a feature, not a limitation. It's meant to answer a different, slower question: is this worth holding through a bad month.
Put them side by side and the split is really about time horizon, not correctness. One is trying to time a trade. The other is trying to judge an asset.
The case where the chart lied and the tokenomics didn't
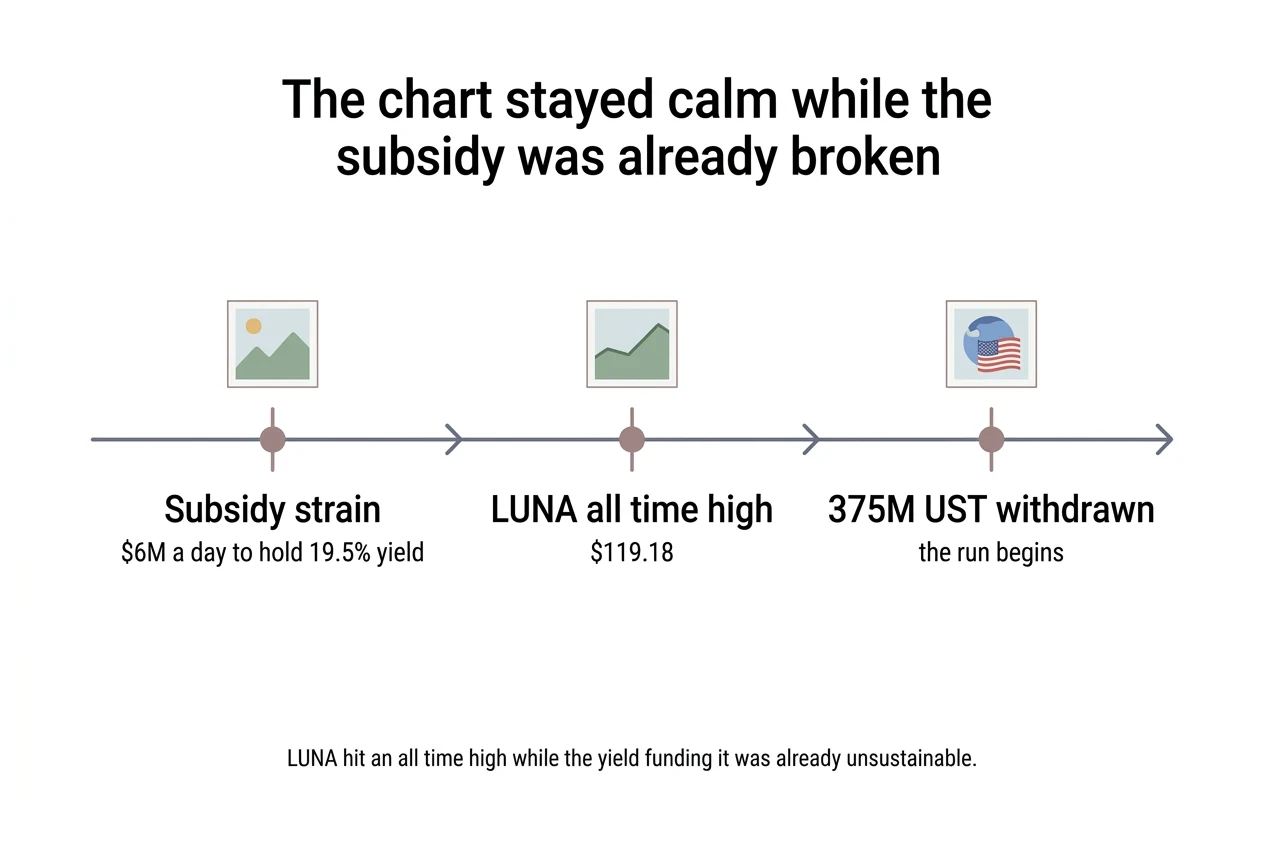
Terra's LUNA is the cleanest example crypto has produced of fundamentals catching a problem the chart hadn't priced in yet. Anchor Protocol, the lending app that ran on Terra's UST stablecoin, was paying depositors a fixed 19.5% yield. That yield wasn't coming from real borrowing demand. It was subsidized, funded by newly minted UST, and by April 2022 that subsidy was costing roughly $6 million a day just to keep the rate steady. That's a fundamental fact: a number in a reserve account, not a shape on a chart.
LUNA's price didn't show any of that stress. None of it. It hit an all-time high of $119.18 on April 5, 2022, weeks after the subsidy math had already become unsustainable and the community was debating how to wind the rate down. A trader reading only the chart had nothing to go on. A trader who'd actually looked at what was funding that 19.5% had reason to be nervous, weeks before the run even started. Two large wallets pulled 375 million UST out of Anchor on May 7, 2022, the withdrawal that started the run that took LUNA to fractions of a cent within days.
📌 Practical rule: technical analysis can only ever react to a problem once it shows up in price. Fundamental analysis is the layer that has a chance of flagging it before that happens, because it's reading the mechanism, not the shadow the mechanism casts on a chart.
Neither one works as well alone as its fans claim
It would be tidy if the lesson were "combine them and you're covered." The more honest lesson, from the closest thing crypto has to a rigorous test of both, is that most of what passes for either kind of analysis doesn't survive contact with real data.
Researchers Mingzhe Wei, Ioannis Kyriakou, Georgios Sermpinis and Charalampos Stasinakis ran exactly that test, published in the International Journal of Finance and Economics in 2024. They picked 12 major cryptocurrencies: Bitcoin, Ethereum, Ripple, Dash, Cardano, Avalanche, Binance Coin, Dogecoin, Polkadot, Litecoin, Terra and Solana. Then they threw a huge net at them: 7,846 technical trading rules, five moving-average ratios, and 59 separate fundamental factors, tested against daily data running from 8 August 2015 to 29 August 2021. Then they corrected for the thing most "this indicator works" claims never bother to check: with thousands of rules tested, some will look profitable purely by luck. Once that correction was applied, almost everything that had looked good stopped looking good.
What actually held up, in-sample and out-of-sample: one technical signal (a short-term moving-average ratio) and one fundamental factor, the Hashrate Index, a measure of how much computing power is securing the Bitcoin network. Out of 7,846 technical rules and 59 fundamental factors, two survived. The paper's own conclusion is blunt: the findings "question the value of both technical and fundamental analysis on cryptocurrencies."
That's not an argument for giving up on either. It's an argument for humility about which specific version of either you're relying on. A moving average someone posted in a Discord and a hashrate chart both fall inside categories that mostly failed this test. That doesn't mean your setup is one of the two that worked, or that it isn't. It means the burden of proof sits with the rule, not with the category it belongs to.
How to actually approach the two of them
Given that neither one is a reliable oracle on its own, the workable order looks like this:
Let fundamentals set the thesis first. Before anything else, decide whether the asset is worth holding at all, based on what it does and who's actually using it. Then check how the supply unlocks and whether the team has done what they said they would. This is slow, unglamorous work. It doesn't produce a trade signal. It produces a yes or a no on whether you want exposure at all, the same question that separates real crypto investment from placing a bet.
Then let technicals decide the timing. Once you know you want exposure, the chart tells you whether now is a reasonable moment to add it. Or whether you're buying into an extended, over-owned move, one more likely to give back the entry than reward it.
Check the fundamentals again when the chart moves against you. This is the step people skip. A falling price feels like a reason to panic regardless of cause. The Anchor yield collapsing was a fundamental reason to worry. A coin dropping 15% because the whole market is red, with nothing changed underneath it, is not the same event, even though the candle looks identical either way.
Stay skeptical of any single rule from either camp, on its own, without seeing it survive real testing. Prove it first. That's the specific finding above: most of both categories don't hold up, whichever crypto trading strategy they're supposedly backing.
In practice, the fundamental research, reading docs, checking on-chain usage, sitting with the tokenomics, has to happen away from a live chart, because that's not what a chart is for, while the technical, market-reading side benefits from being screened rather than watched one asset at a time. GeckoScreener covers that half: real-time screening across 100+ coins, refreshed every 60 seconds, with 19 candlestick pattern detectors and a plain-language builder for turning a described setup into a live screen. Treat it as the timing layer of the process above, not a replacement for the fundamental homework that has to happen first.
The next time someone tells you the chart says sell while the fundamentals say hold, they might both be right. They're just answering different questions.
GeckoScreener Team
Written for the GeckoScreener community. Join us on Telegram →
Related Articles



Start screening cryptocurrencies for free
Apply strategies like this one in real-time across 250+ coins.
Try GeckoScreener →