Reversal Candlestick Patterns: What the Real Data Shows
Hammer and shooting star barely beat a coin flip. Bulkowski's own data on reversal candlestick patterns shows which ones actually predict a turn, and why.
GeckoScreener Team
Sep 3, 2026 · 8 min read
Updated about 1 month ago
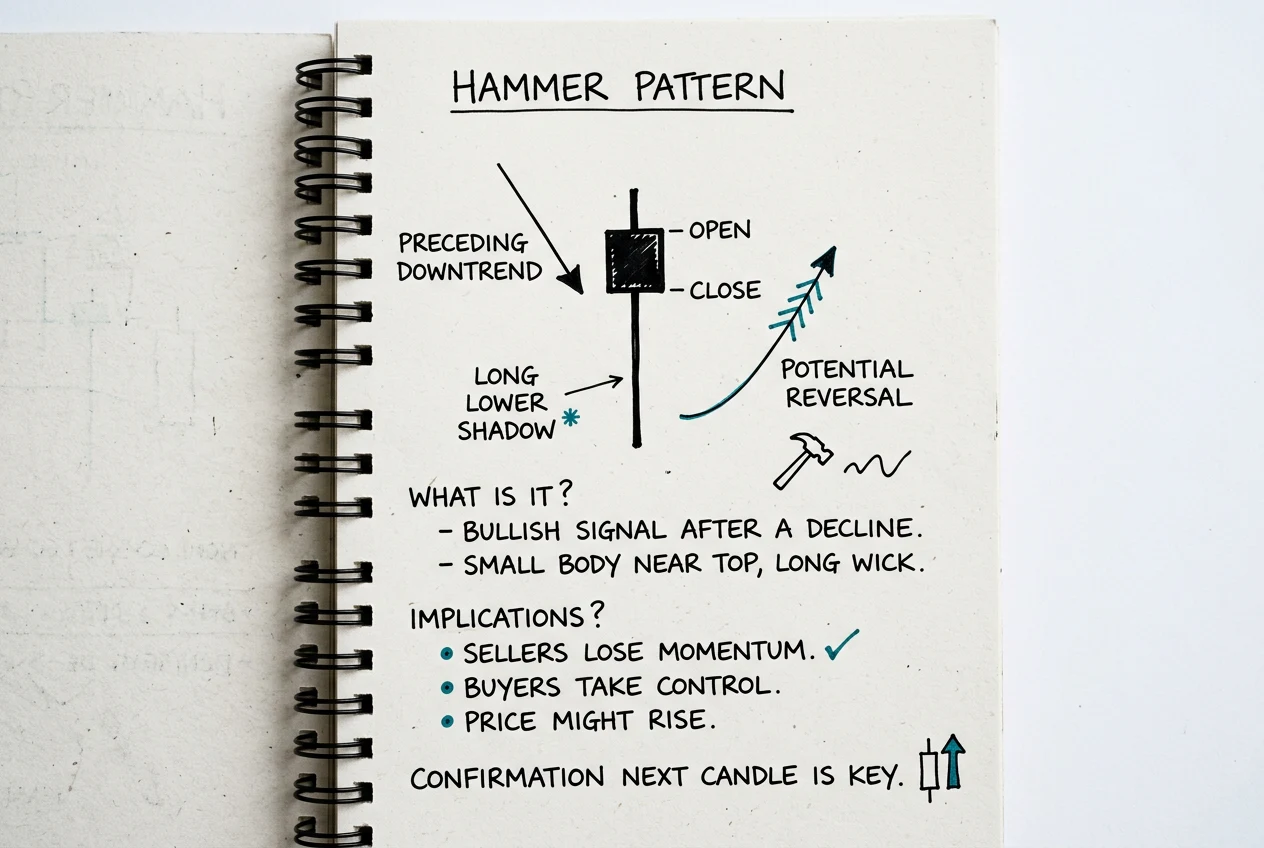
A hammer shows up at the bottom of a long red run. Every guide on the internet tells you the same thing about reversal candlestick patterns like this one: buyers are stepping in, the reversal is here. Trust the shape, and you're trading on something that's barely better than a coin flip. At least, that's what the trader who actually counted the outcomes found.
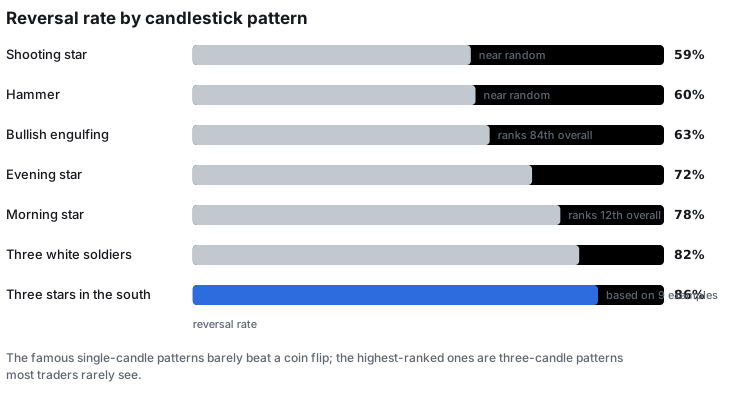
In short: Thomas Bulkowski's own tested figures put the hammer's reversal rate at 60% and the shooting star's at 59%, both of which he calls "near random." Bullish engulfing reverses 63% of the time but ranks 84th out of 103 candlestick patterns once you look at what happens after. The patterns with the best-looking numbers, three stars in the south (86%) and bearish three-line strike (84%, and it flips bullish), are built on 9 and 85 examples. Morning star, at 78% and ranked 12th, is the more boring, better-supported middle ground. None of them are a trade on their own.
What actually counts as a reversal pattern
A reversal candlestick pattern is one to three candles that claim to show a trend running out of steam and turning the other way. Single-candle patterns, hammer, shooting star, doji, are the fastest to spot. They're also the weakest evidence. Two-candle patterns, bullish and bearish engulfing, piercing line, dark cloud cover, need the second candle to swallow or cut deep into the first. Three-candle patterns, morning star, evening star, three white soldiers, three black crows, ask for a full three-day story: exhaustion, indecision, then confirmation.
There's one rule every version of this shares: a bullish pattern only means anything after a downtrend, and a bearish one only after an uptrend. A hammer in the middle of a sideways chop isn't a signal. It's just a candle with a long lower wick. Reading candles at all is only one lens on a chart; it sits alongside the other ways traders actually size up a coin, like on-chain data and sentiment.
The patterns everyone learns first aren't the reliable ones
Thomas Bulkowski has spent decades doing the unglamorous part: pulling real candle data across hundreds of stocks and counting, pattern by pattern, how often the price actually turned afterward. His numbers, published on thepatternsite.com, are the closest thing candlestick trading has to an audited track record. They're also rougher on the famous patterns than most guides let on.
The hammer, the single candle every beginner learns first, acts as a bullish reversal 60% of the time. Bulkowski's own description of that number: "not bad, but it's also not far from random." Worse, the move that follows a correct hammer signal is small enough that he ranks it 65th out of 103 patterns overall. The shooting star, the hammer's bearish mirror, reverses 59% of the time, which he sums up as "looks better than it performs."
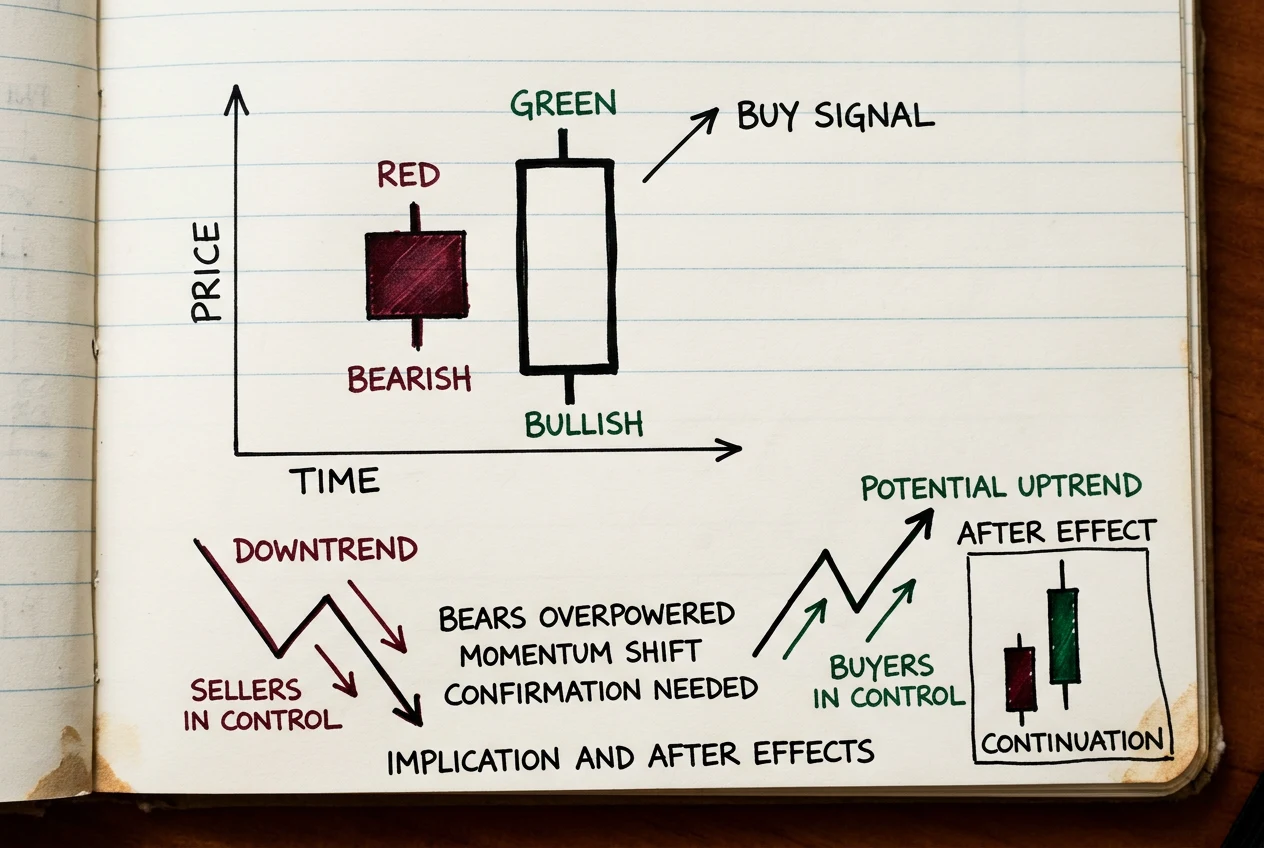
Bullish engulfing, the two-candle pattern where a big green candle swallows the red one before it, does better on the headline number: a 63% reversal rate. It's also common, ranked 12th out of 103 for how often it shows up. But factor in how far price actually moves afterward, and it drops to 84th out of 103. Bulkowski's blunt verdict: "post breakout performance can be dreadful."
📌 Practical rule: a reversal rate and a profitable trade are two different numbers. Bullish engulfing turns the price around most of the time and still ranks near the bottom of the list for what that turn is actually worth.
The patterns that rank highest are the ones you'll almost never see
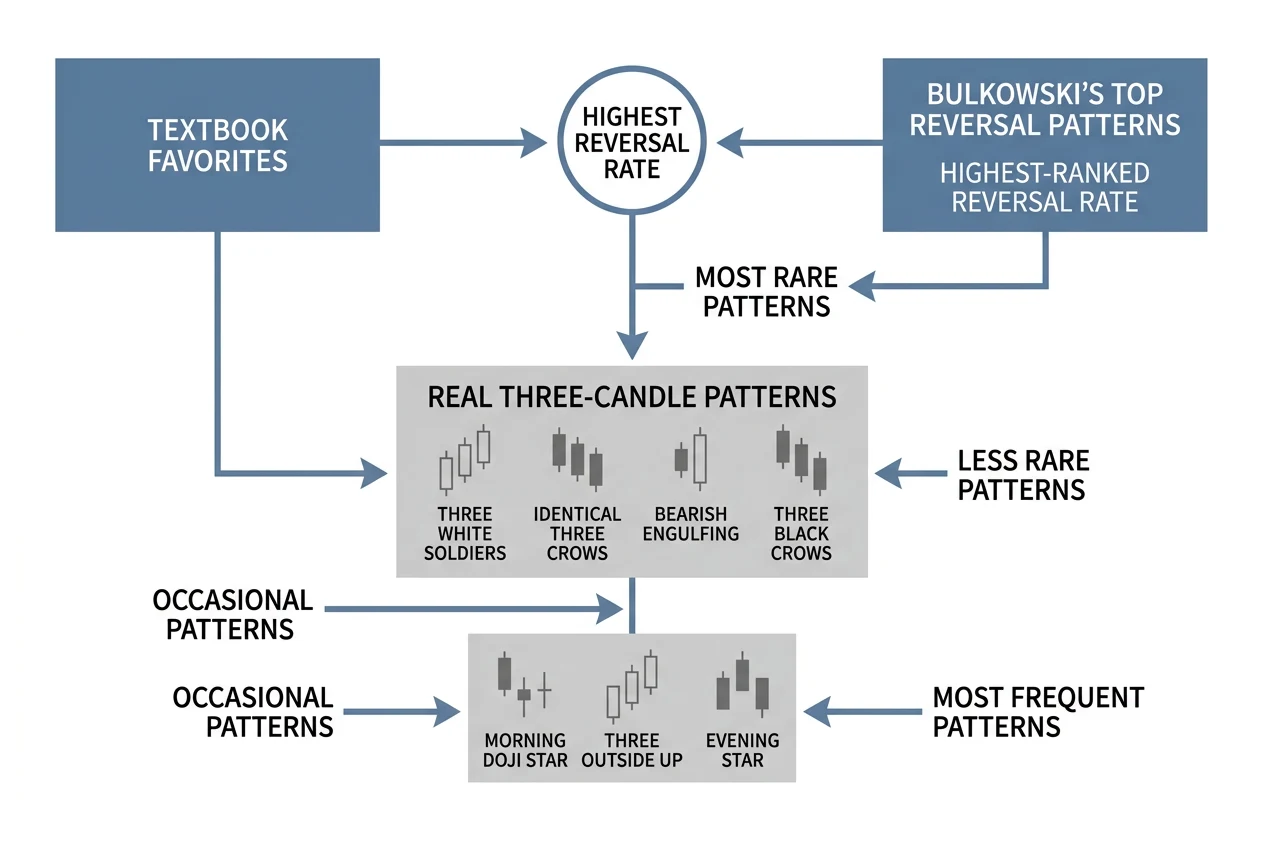
Bulkowski's top 10 reversal candlesticks, ranked purely by how often they call the turn correctly, are led by three stars in the south at 86% and bearish three-line strike at 84%. Both numbers sound like exactly what a trader wants. Neither should be trusted the way the headline suggests.
Three stars in the south is so rare that Bulkowski found only 9 examples to study, and he says so directly: "anything I say on this web page is likely wrong." Despite the 86% reversal rate, it ranks dead last, 103rd out of 103, on actual post-signal performance. Bearish three-line strike is stranger still. Its name says bearish continuation. The data says it actually acts as a bullish reversal 84% of the time, the opposite of what the textbook definition claims. That number comes from just 85 confirmed examples, found across more than 4.7 million candle lines searched. Bulkowski's own conclusion: "drawing conclusions from what appears to be top-rated performance is risky and should be avoided."

The rest of the top 10, three white soldiers (82%), identical three crows (79%), bearish engulfing (79%), three black crows (78%), morning doji star (76%), three outside up (75%), and evening star (72%), sit in between: real three-candle patterns, less freakishly rare than the top two, still not something you'll see on a chart every week.
Morning star is the more boring, better-supported middle
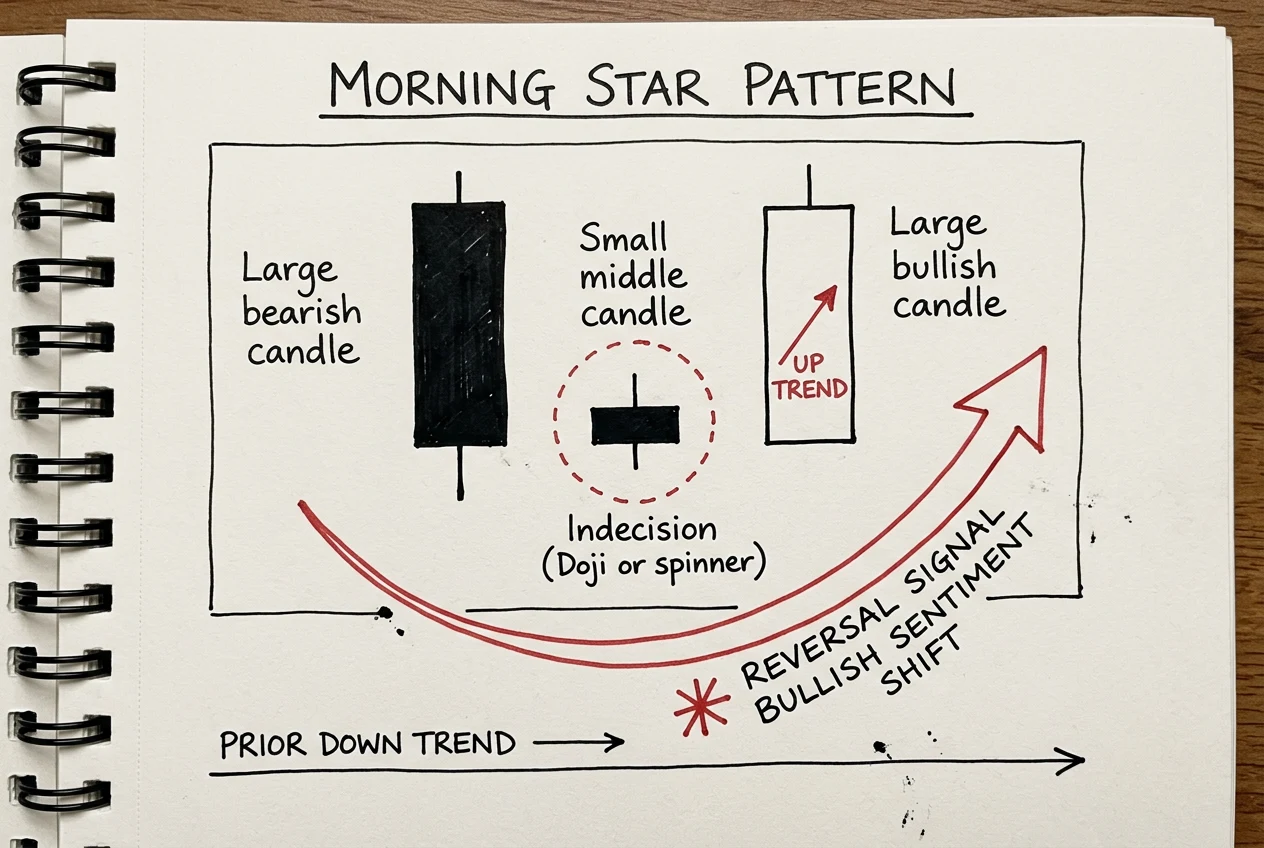
If you want one pattern that's both reasonably common and reasonably well tested, morning star is the closest thing on this list. Its three candles, a long red candle, a small-bodied candle showing the sellers losing conviction, then a long green candle closing back into the first candle's body, reverse a downtrend 78% of the time. Bulkowski ranks it 12th best of 103 patterns, with a frequency rank of 66th, so you'll actually run into it. It isn't spectacular. It's just the pattern with the least reason to distrust its own numbers.
Confirmation is what turns a shape into a signal
Every pattern above is a shape, not a rule. Three things decide whether that shape is worth acting on:
- Where it sits. A bullish pattern only counts after a real downtrend. A bearish one only counts after a real uptrend. The same candles in a flat, directionless chart mean nothing.
- Volume on the last candle. A reversal candle on volume well below the recent average is more often noise than conviction. Traders generally want to see volume clearly above average before trusting the shape.
- What the next candle does. Most versions of these patterns, including Bulkowski's, measure performance starting from a confirmed breakout, not from the pattern candle itself. The pattern is the setup. The candle after it is the confirmation.
This video walks through what happens when you actually backtest candlestick signals on Bitcoin instead of eyeballing them on a chart, which is the honest way to find out whether a shape you like the look of is actually worth anything.

What this means if you're watching more than one chart
Put the two problems next to each other and the shape of the trouble is obvious. The patterns you'll actually see often, hammer, shooting star, bullish engulfing, are only modestly better than a coin flip. The patterns with genuinely strong numbers, three stars in the south, bearish three-line strike, are so rare that most traders will go years without a real one, and even Bulkowski warns against trusting the sample size behind them.
That's not really an argument against candlesticks. It's an argument against watching one chart and waiting. A pattern with a 78 to 86% reversal rate is still useful information. It just shows up on a handful of assets on any given day, not the one you happen to have open. GeckoScreener runs 19 candlestick pattern detectors, including engulfing, doji, hammer, morning star, and shooting star, across 100+ cryptocurrencies refreshed every 60 seconds. That's a more realistic way to catch a rare three-candle pattern than refreshing one chart by hand. It won't tell you a signal is guaranteed to work; nothing above does that either. It just means you're actually there when the rare, better-supported pattern shows up, instead of finding out about it a day late. Turning a pattern like that into an actual rule you'd trade is the same question behind any backtested strategy: the shape has to prove itself against real history, not just look right on the day.
So which one do you actually trust
None of them, alone. Trust the ones with a real sample size and a decent rank, morning star, three white soldiers, evening star, over the ones that only look convincing, hammer, shooting star, three stars in the south. Then still ask the same three questions before you act on any of them: was there a real trend to reverse, was there volume behind the candle, and did the next candle actually confirm it. A shape that passes all three isn't a guarantee. It's just the closest thing to evidence a candlestick chart can give you.
GeckoScreener Team
Written for the GeckoScreener community. Join us on Telegram →
Related Articles



Start screening cryptocurrencies for free
Apply strategies like this one in real-time across 250+ coins.
Try GeckoScreener →